IBM Cloud Pak for Data (CP4D) on AWS Modernization Workshop > Low/No Code ML Lab > Start the lab > 3. Visualization > 3.2. Analyze Cognos Embedded Dashboard
Analyze Cognos Embedded Dashboard
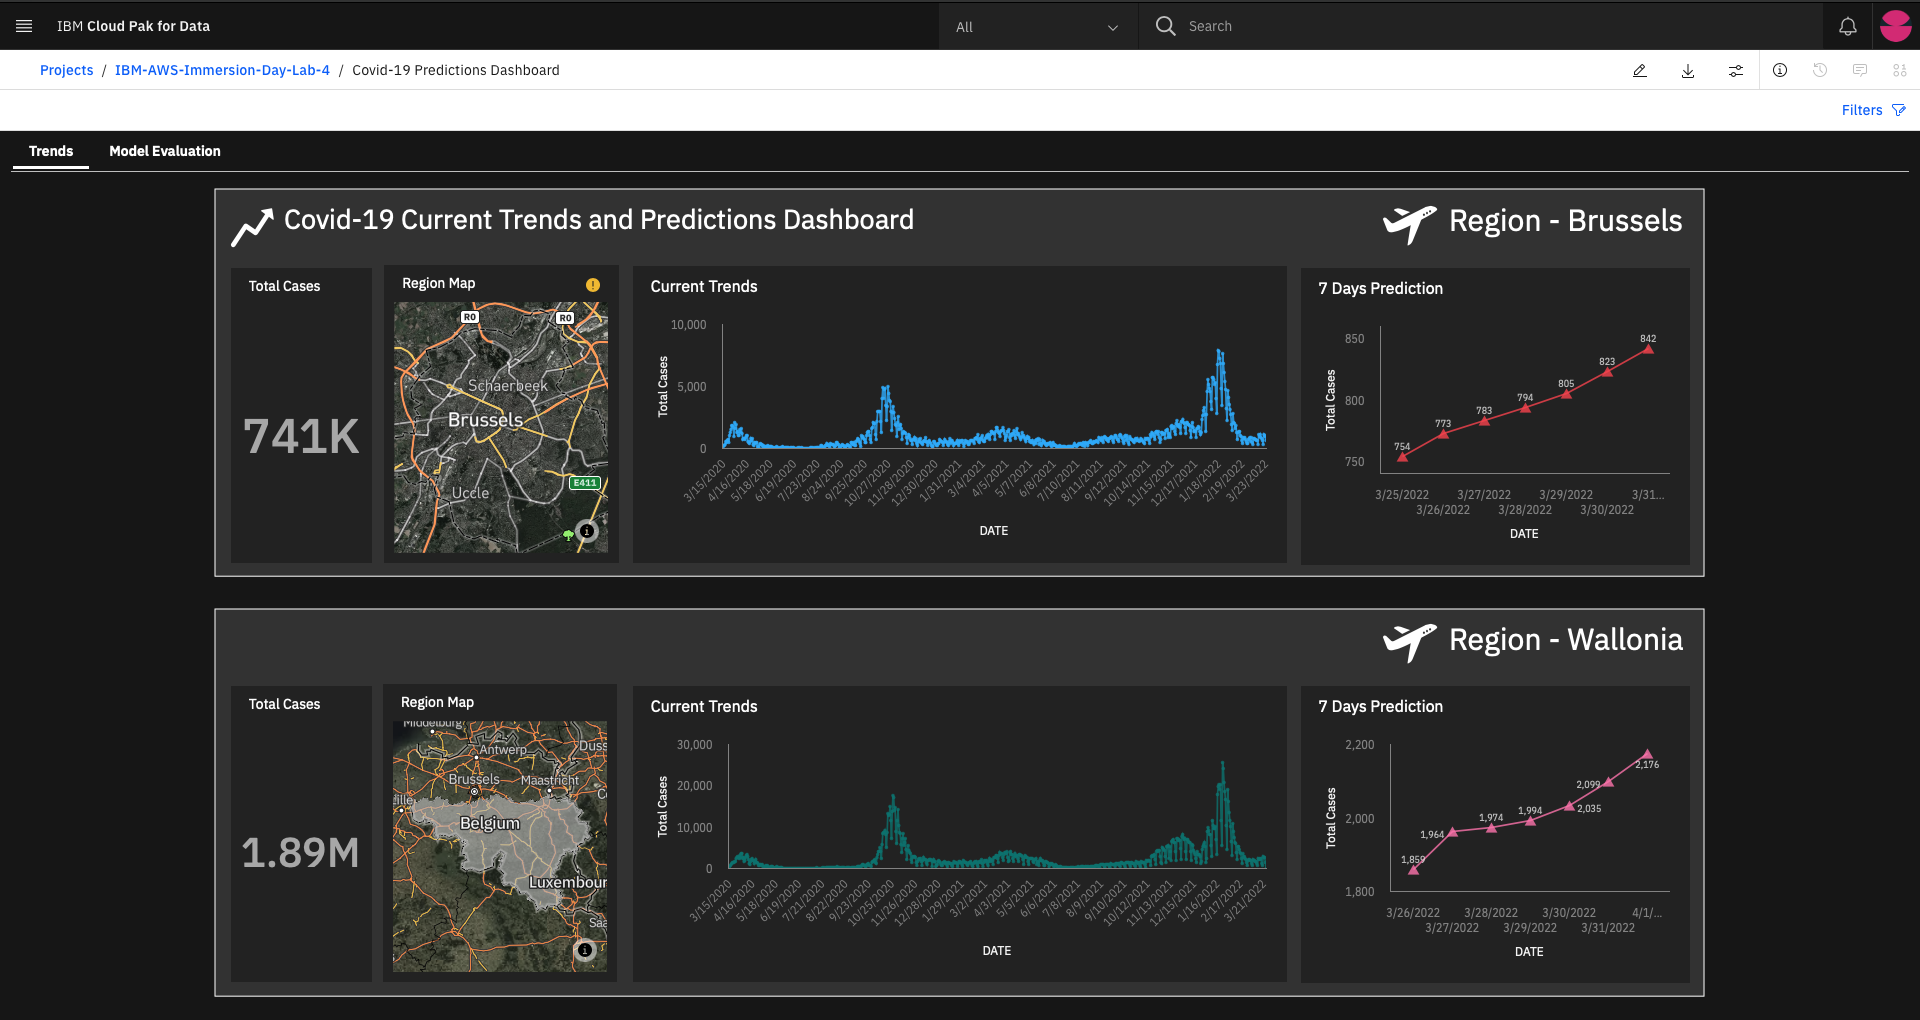
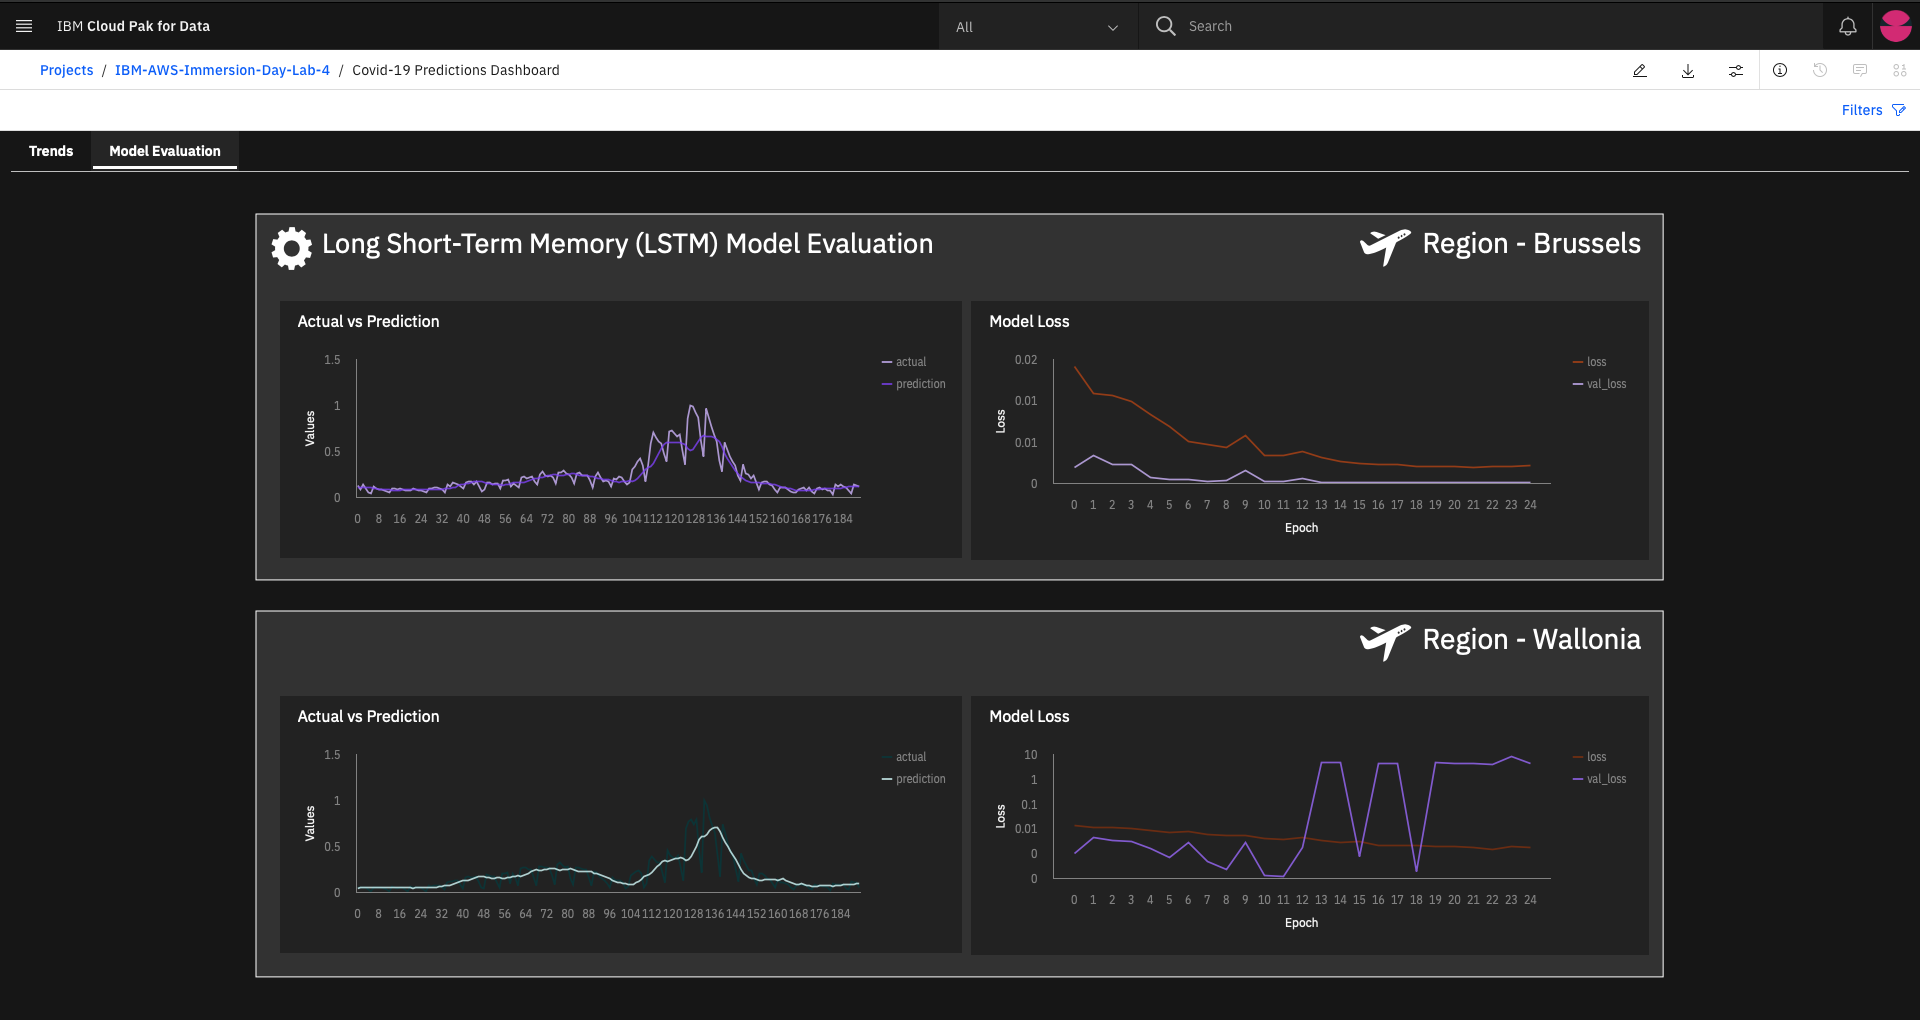
There are two tabs in the Dashboard Trends and Model Evaluation.
-
Trends Tab has the following widgets for the Brussels and Wallonia regions:
- Total Cases: Shows the total number of cases for the Region.
- Region Map: Shows the map of the Region.
- Current Trends: Shows the current trends for the Region.
- 7 Days Prediction: Shows the 7 days prediction for the Region.
-
Model Evaluation Tab has the following widgets for the Brussels and Wallonia regions:
- Actual vs Predicted: Shows the actual vs predicted values for the model of the perticular Region.
- Model Loss: Shows the model loss for the model of the perticular Region.
The Dashboard is interactive, you can click on any data point from the dashboard to see the details change in realtime.