Data Virtualization Lab
Learning Objectives:
In this tutorial you will learn:
- How to make a connection between external data sources & IBM CP4D connectors.
- How to query multiple data sources wihout creating data replicas using IBM Data Virtualization service.
Learning Outcome:
At the end of the workshop you will learn how to connects multiple data sources across locations by creating one virtual data view.
For this workshop, you have Covid-19 regional data stored in Amazon S3 and Amazon Aurora PostgreSQL data sources. In this workshop you will use IBM Data Virtualization Service to create virtual data view.
The proposed solution will solves data silos challenges faced by enterprises which force them to copy the data into centralized repository for analytics.
Prerequisites:
- IBM Cloud Pak for Data
- Data Virtualization on IBM Cloud Pak for Data
- External Data Sources (Amazon S3, Amazon Aurora PostgreSQL)
- IBM Watson Knowledge Catalog
Estimated time:
It should take you approximately 10-15 minutes to complete this lab.
Lab Steps:
Step 1: Login to IBM Cloud Pak for Data with valid credentials
To perform this lab you need IBM Cloud Pak for Data’s user credentials (eg. userxxxx) which you have created earlier. Credentials include both username and password. If you do not have the credentials then refer Infra Provisioning Lab exercise to get the credentials.
Step 2: Create connection with AWS data sources using IBM CP4D connectors
In this lab, you will create connection with Amazon S3, and Amazon RDS data sources. Follow the below steps to create connection with those data sources:
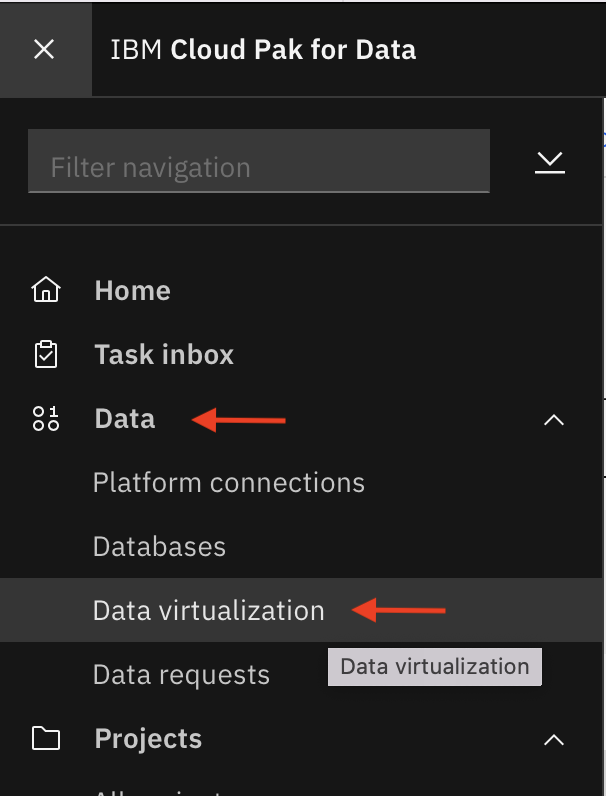
- Click Navigation Menu -> Expand ‘Data’ and then click ‘Data Virtualization’
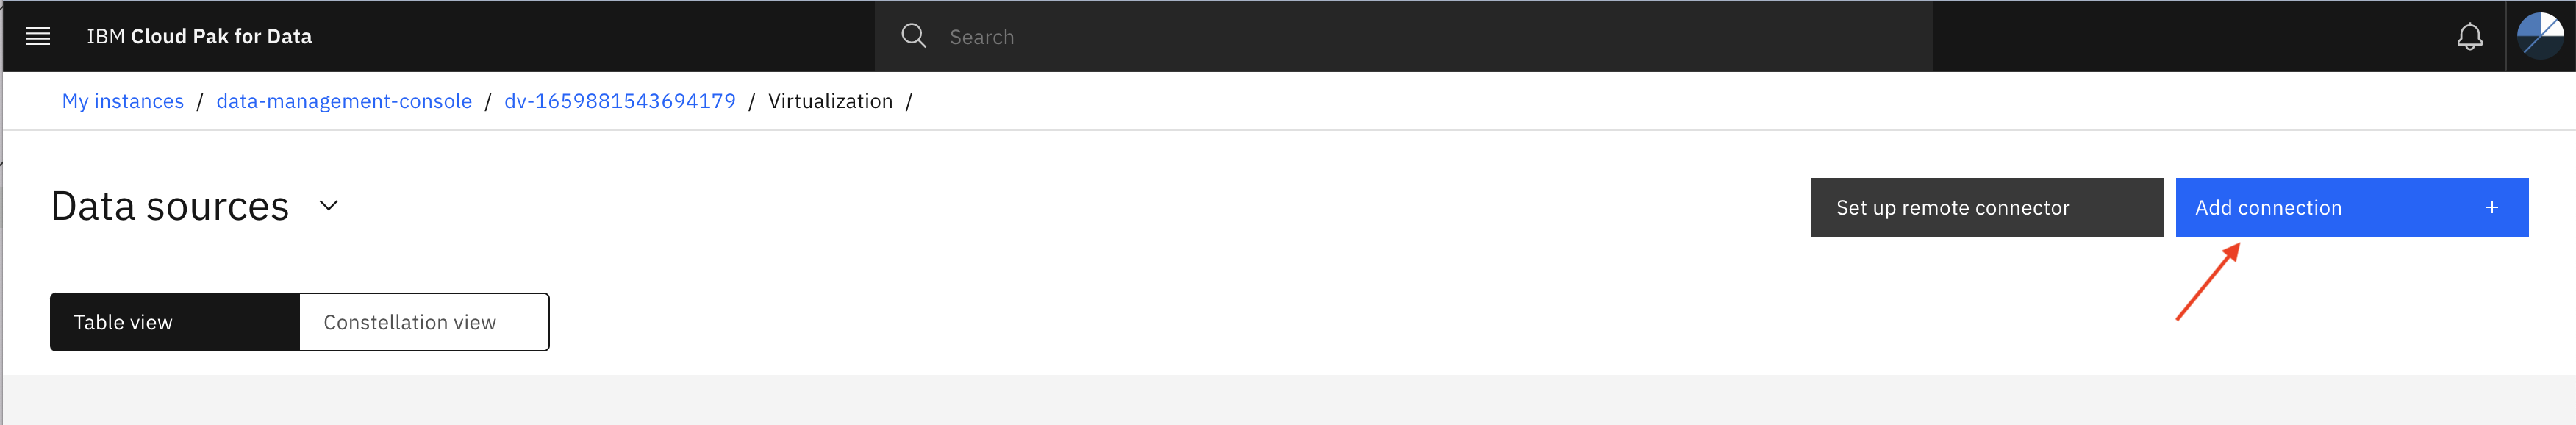
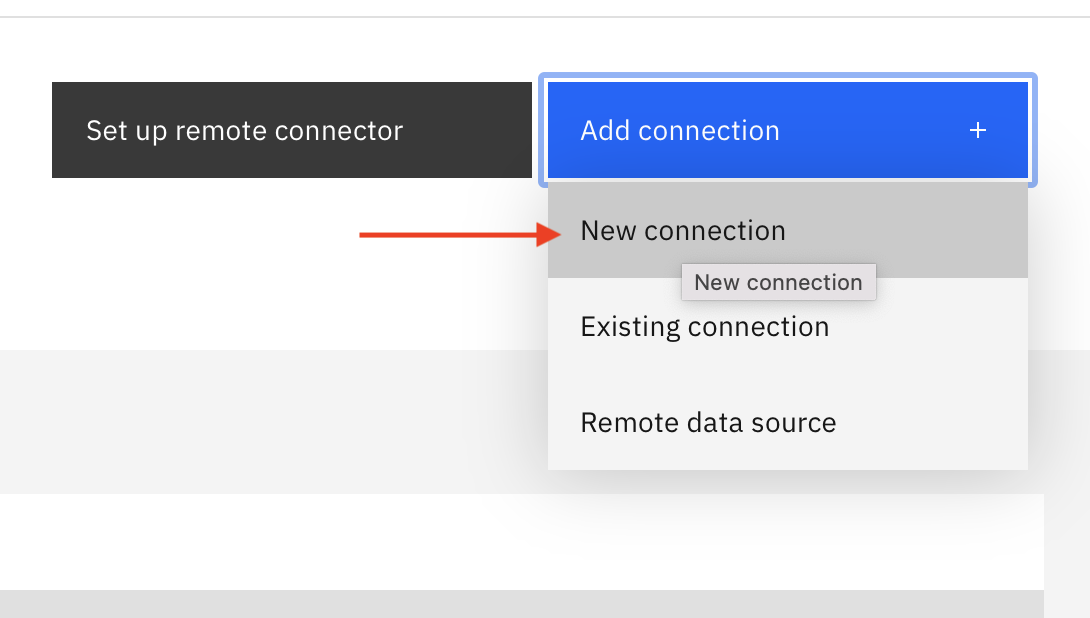
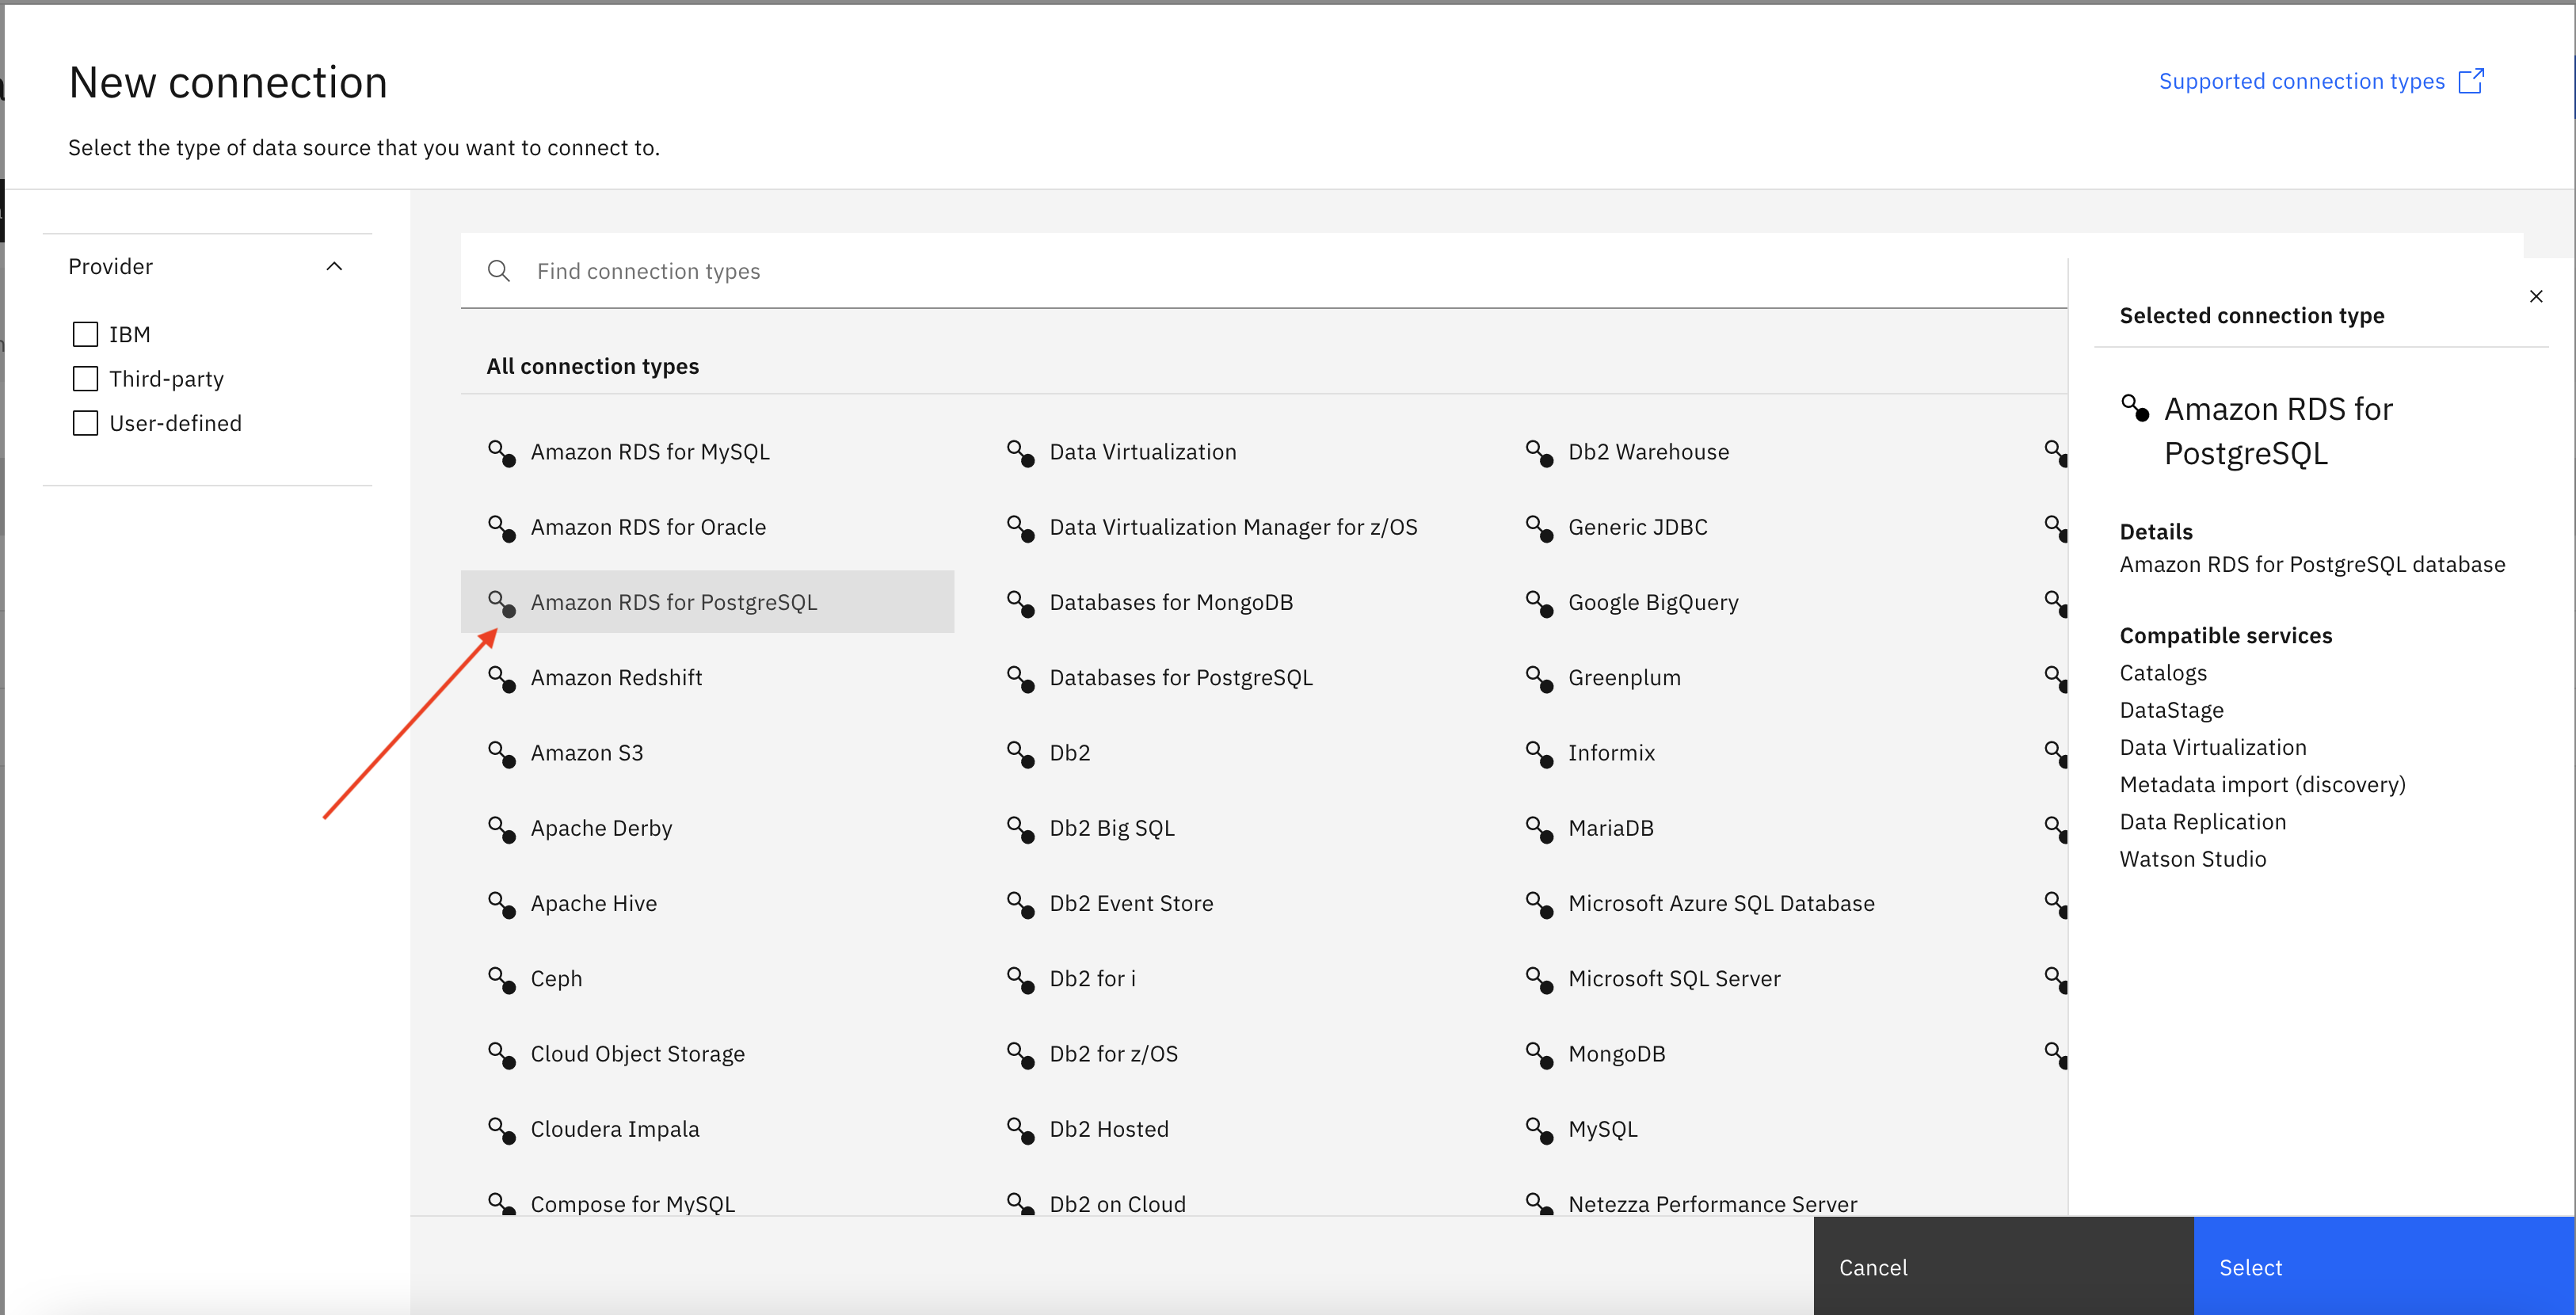
- In the Data Virtualization Page, Click Add connection + New Connection.
- Select ‘Amazon RDS for PostgreSQL’ connection type and then click on Select.
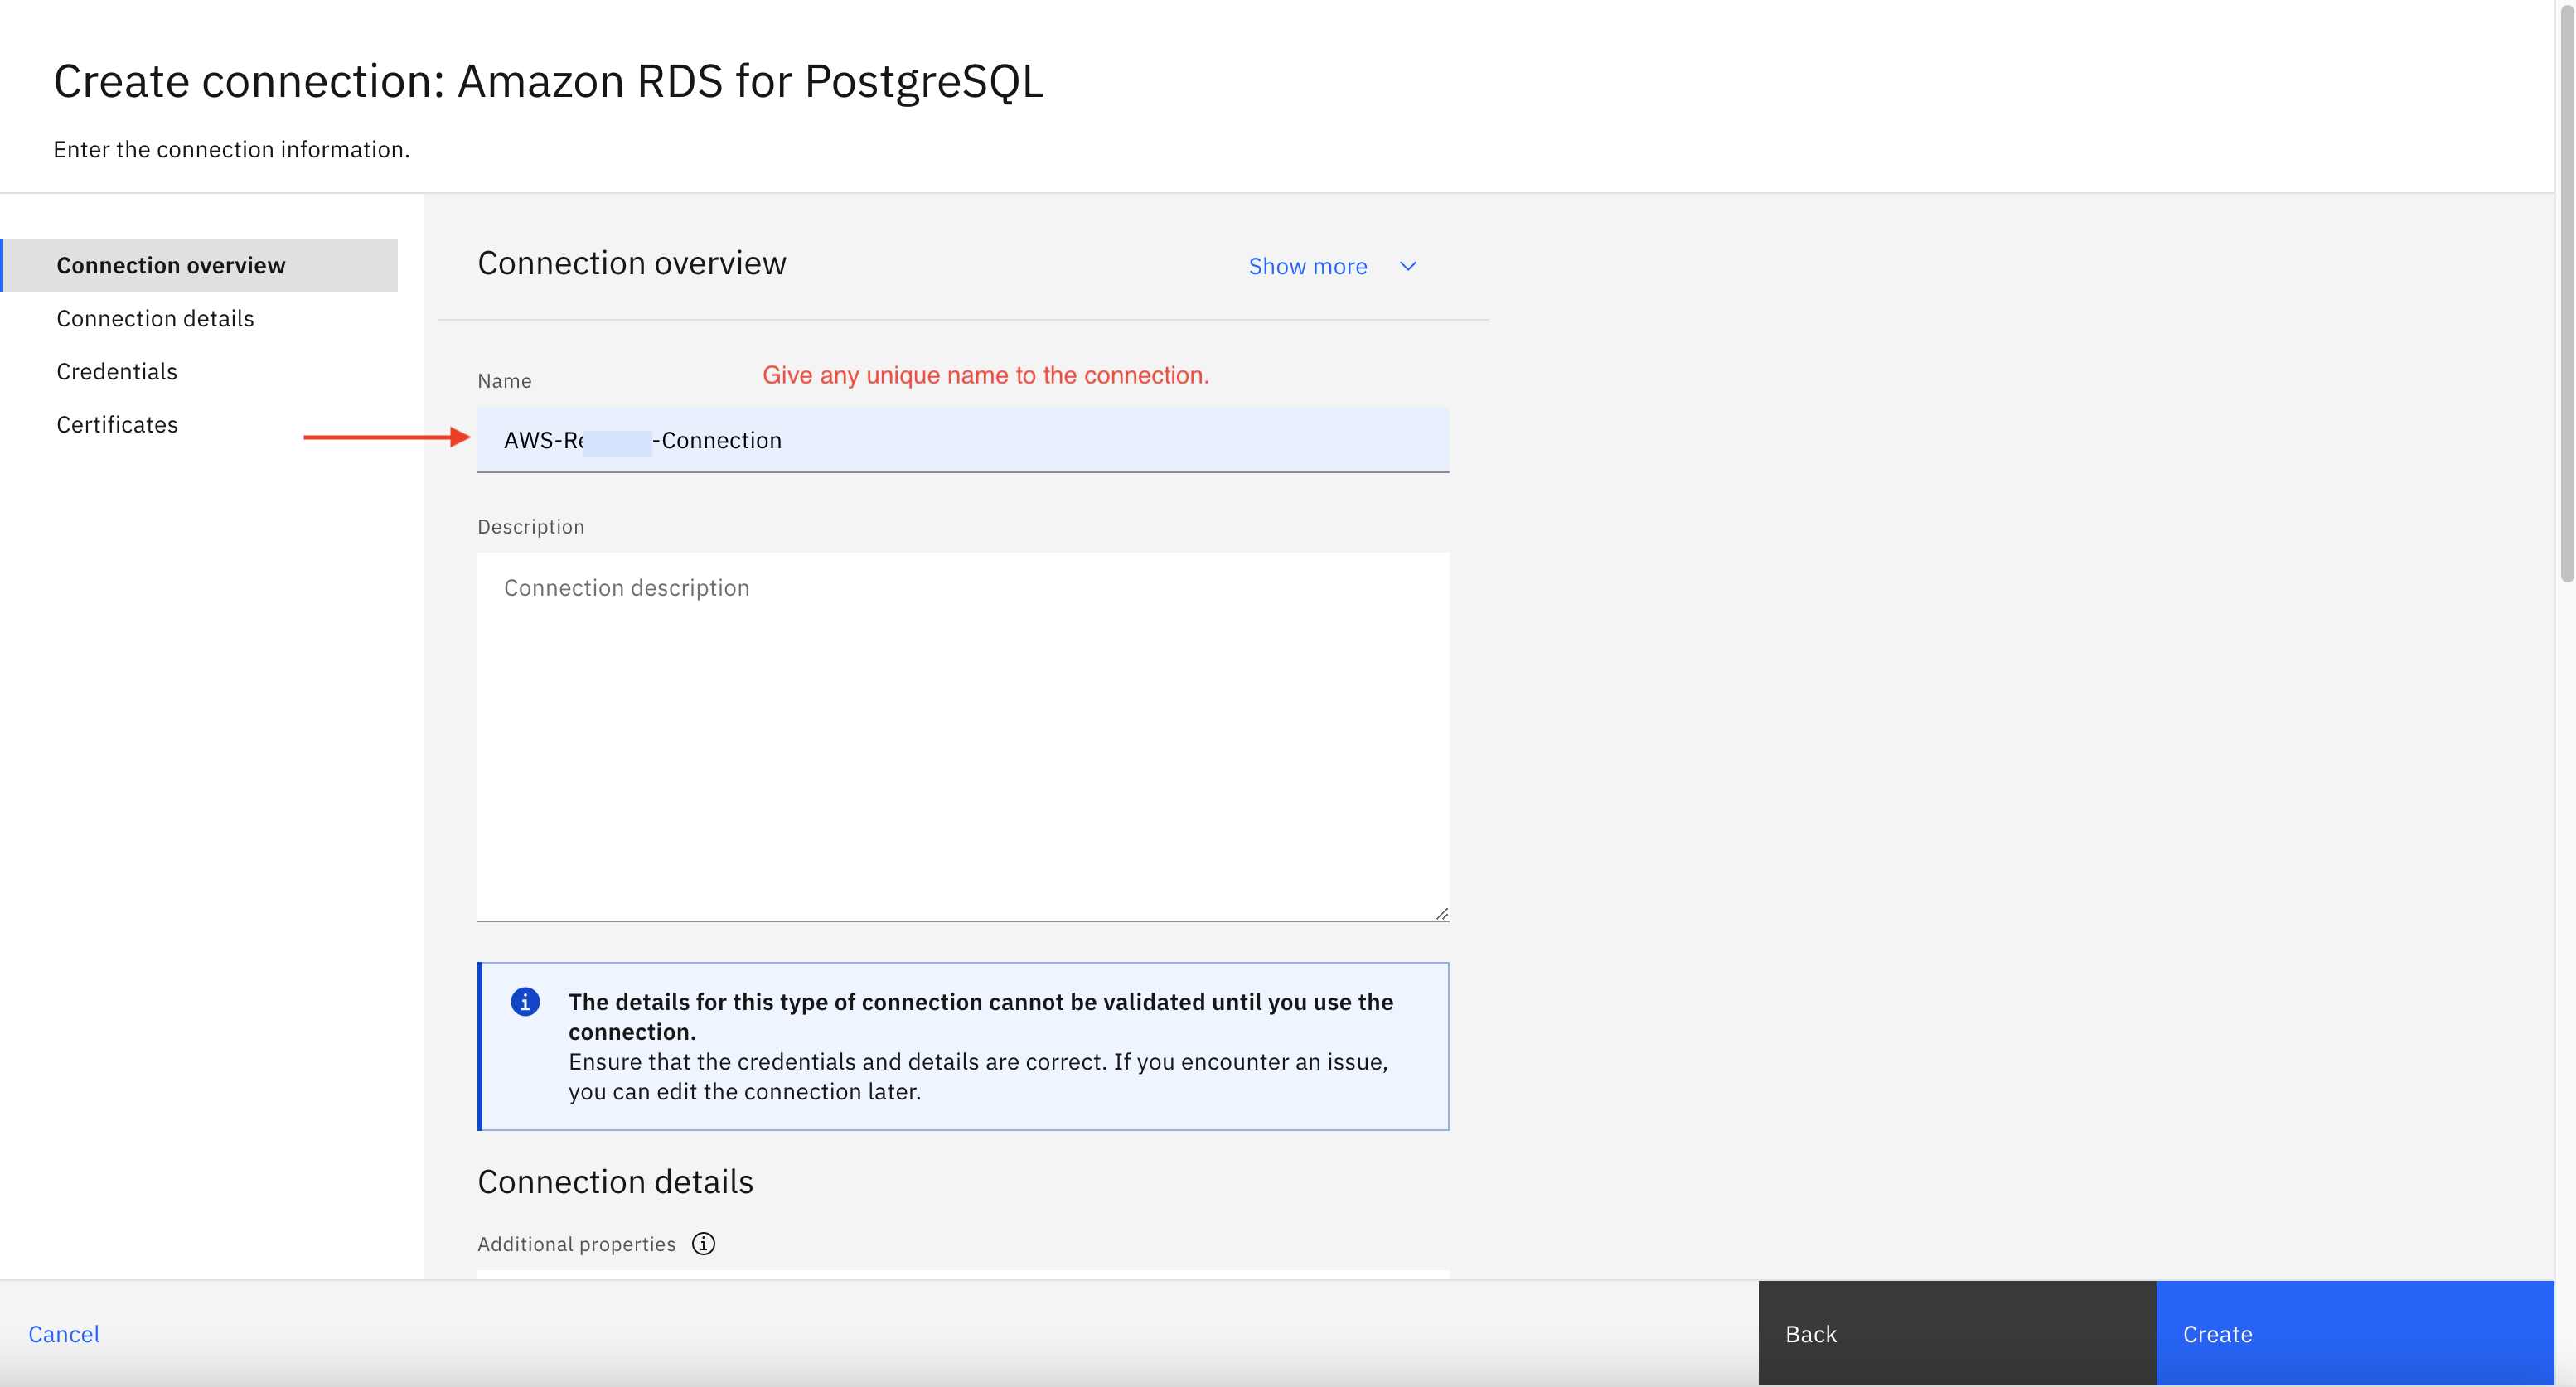
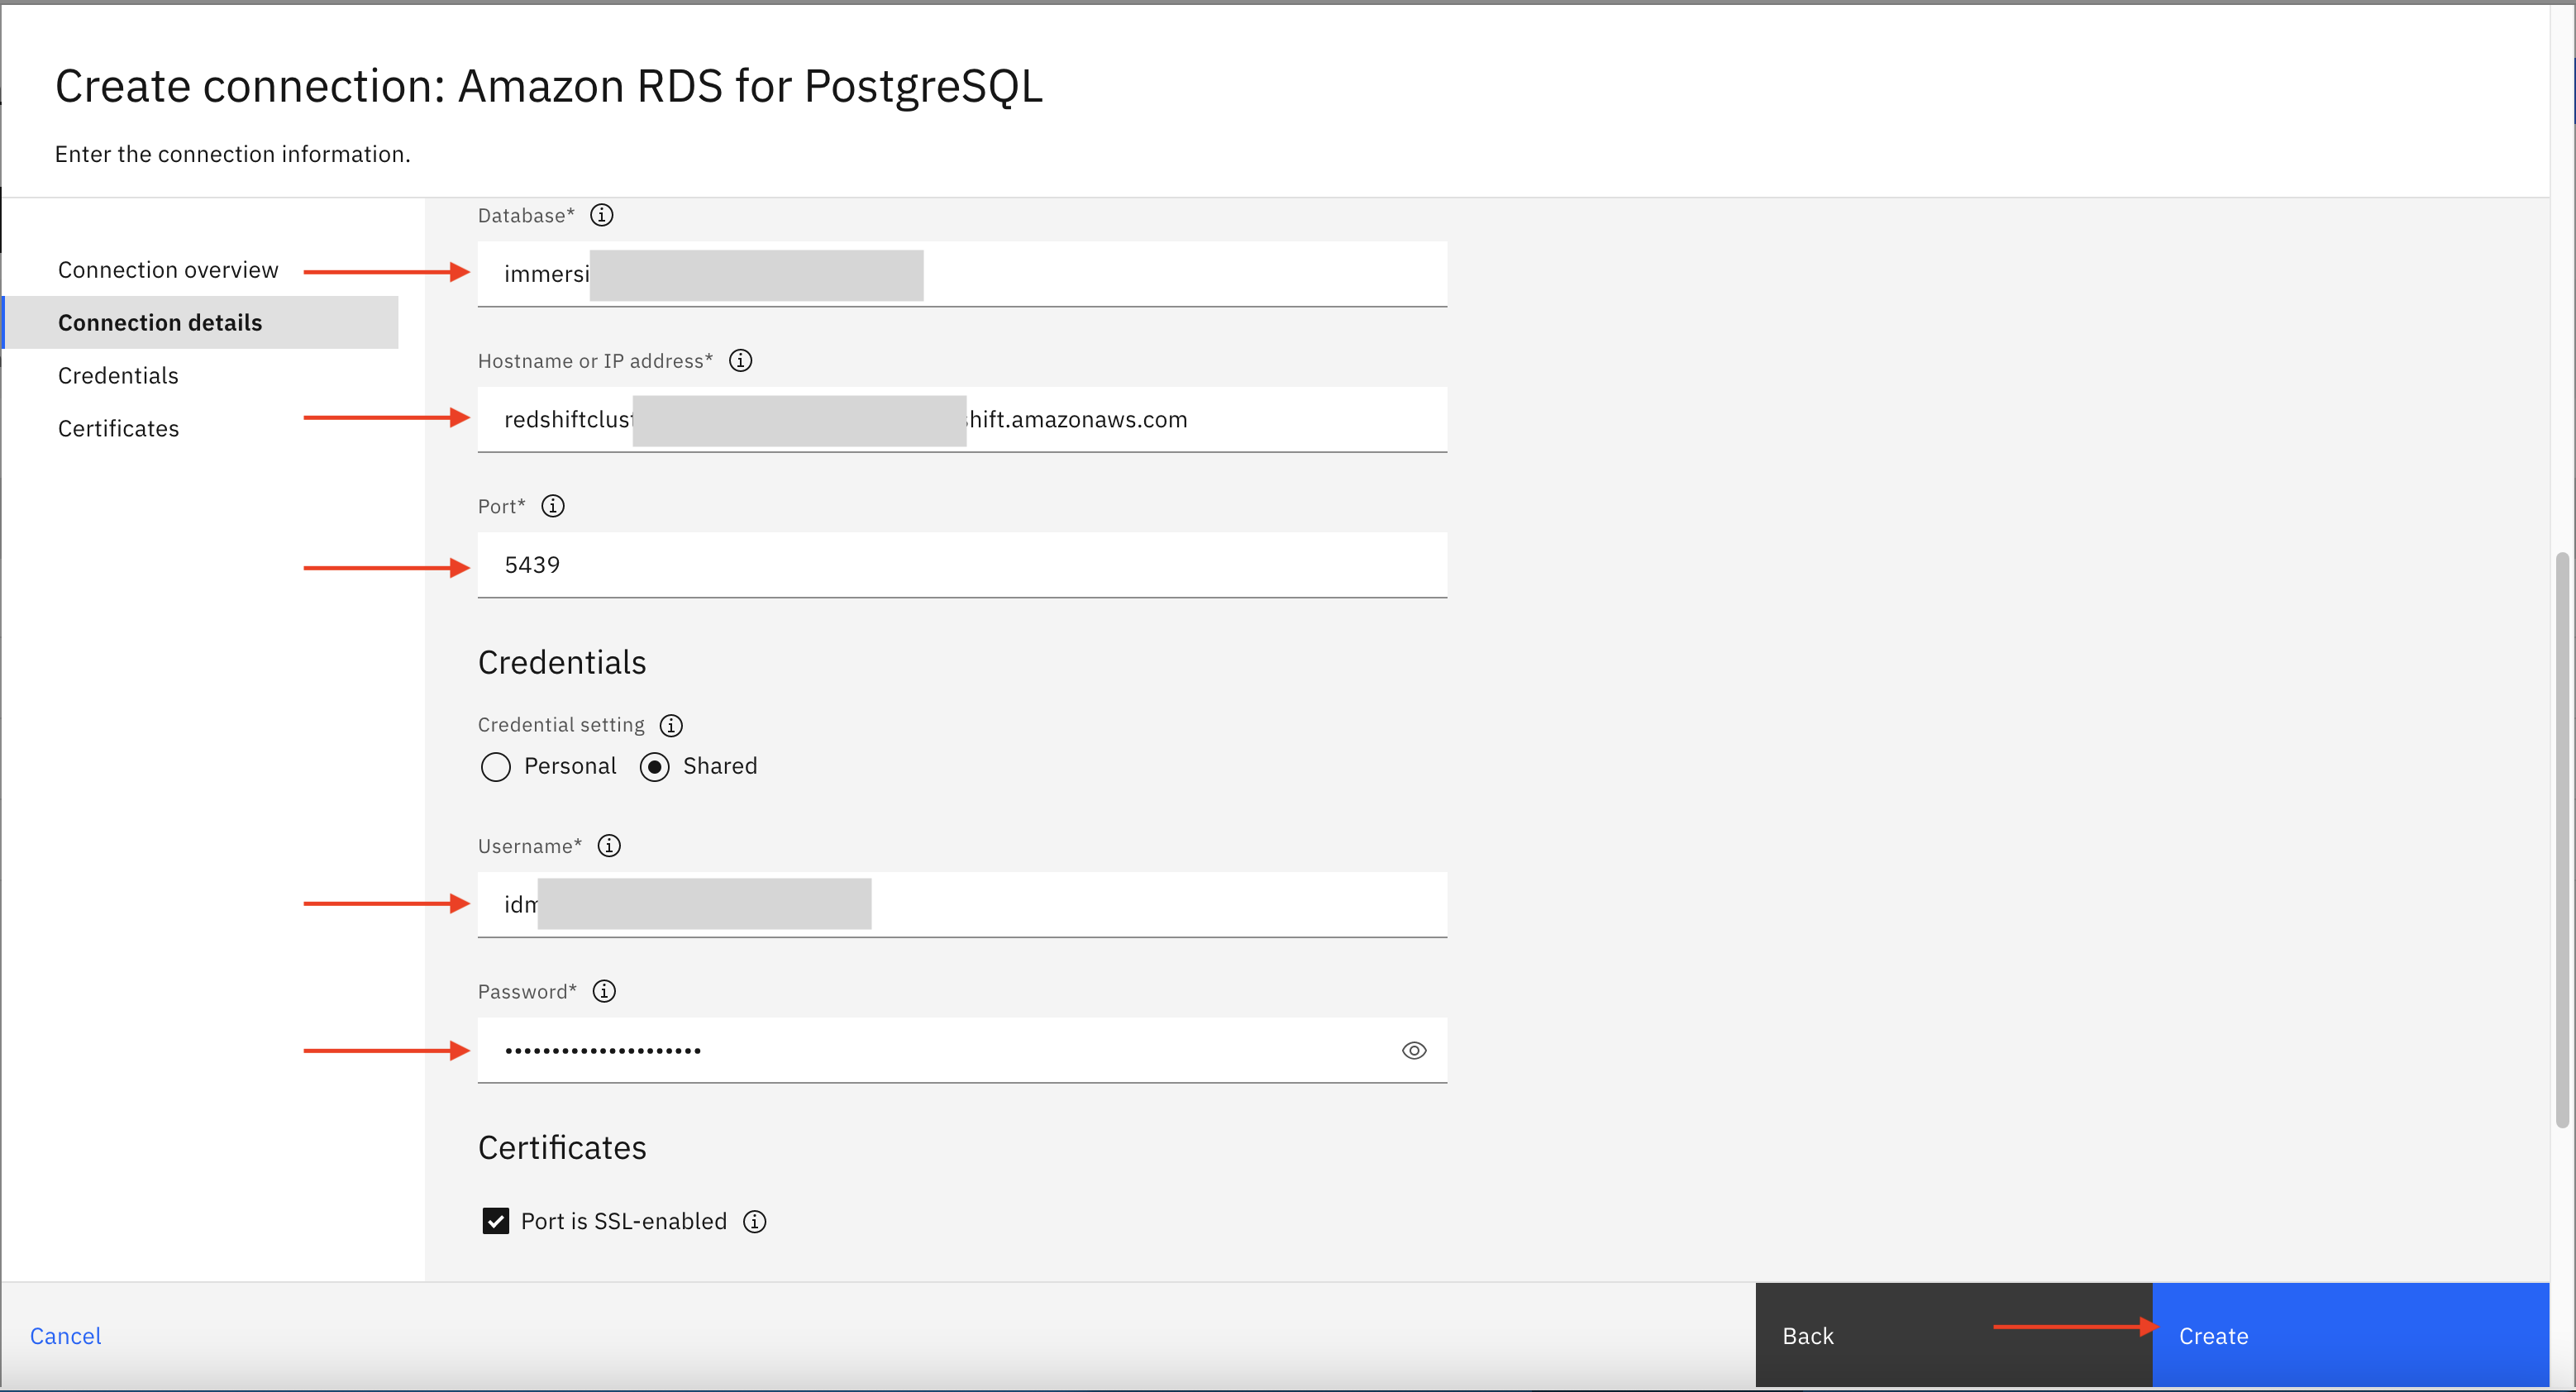
You can also specify a connection name and other details as shown in below image then click Create to create Amazon RDS connection.
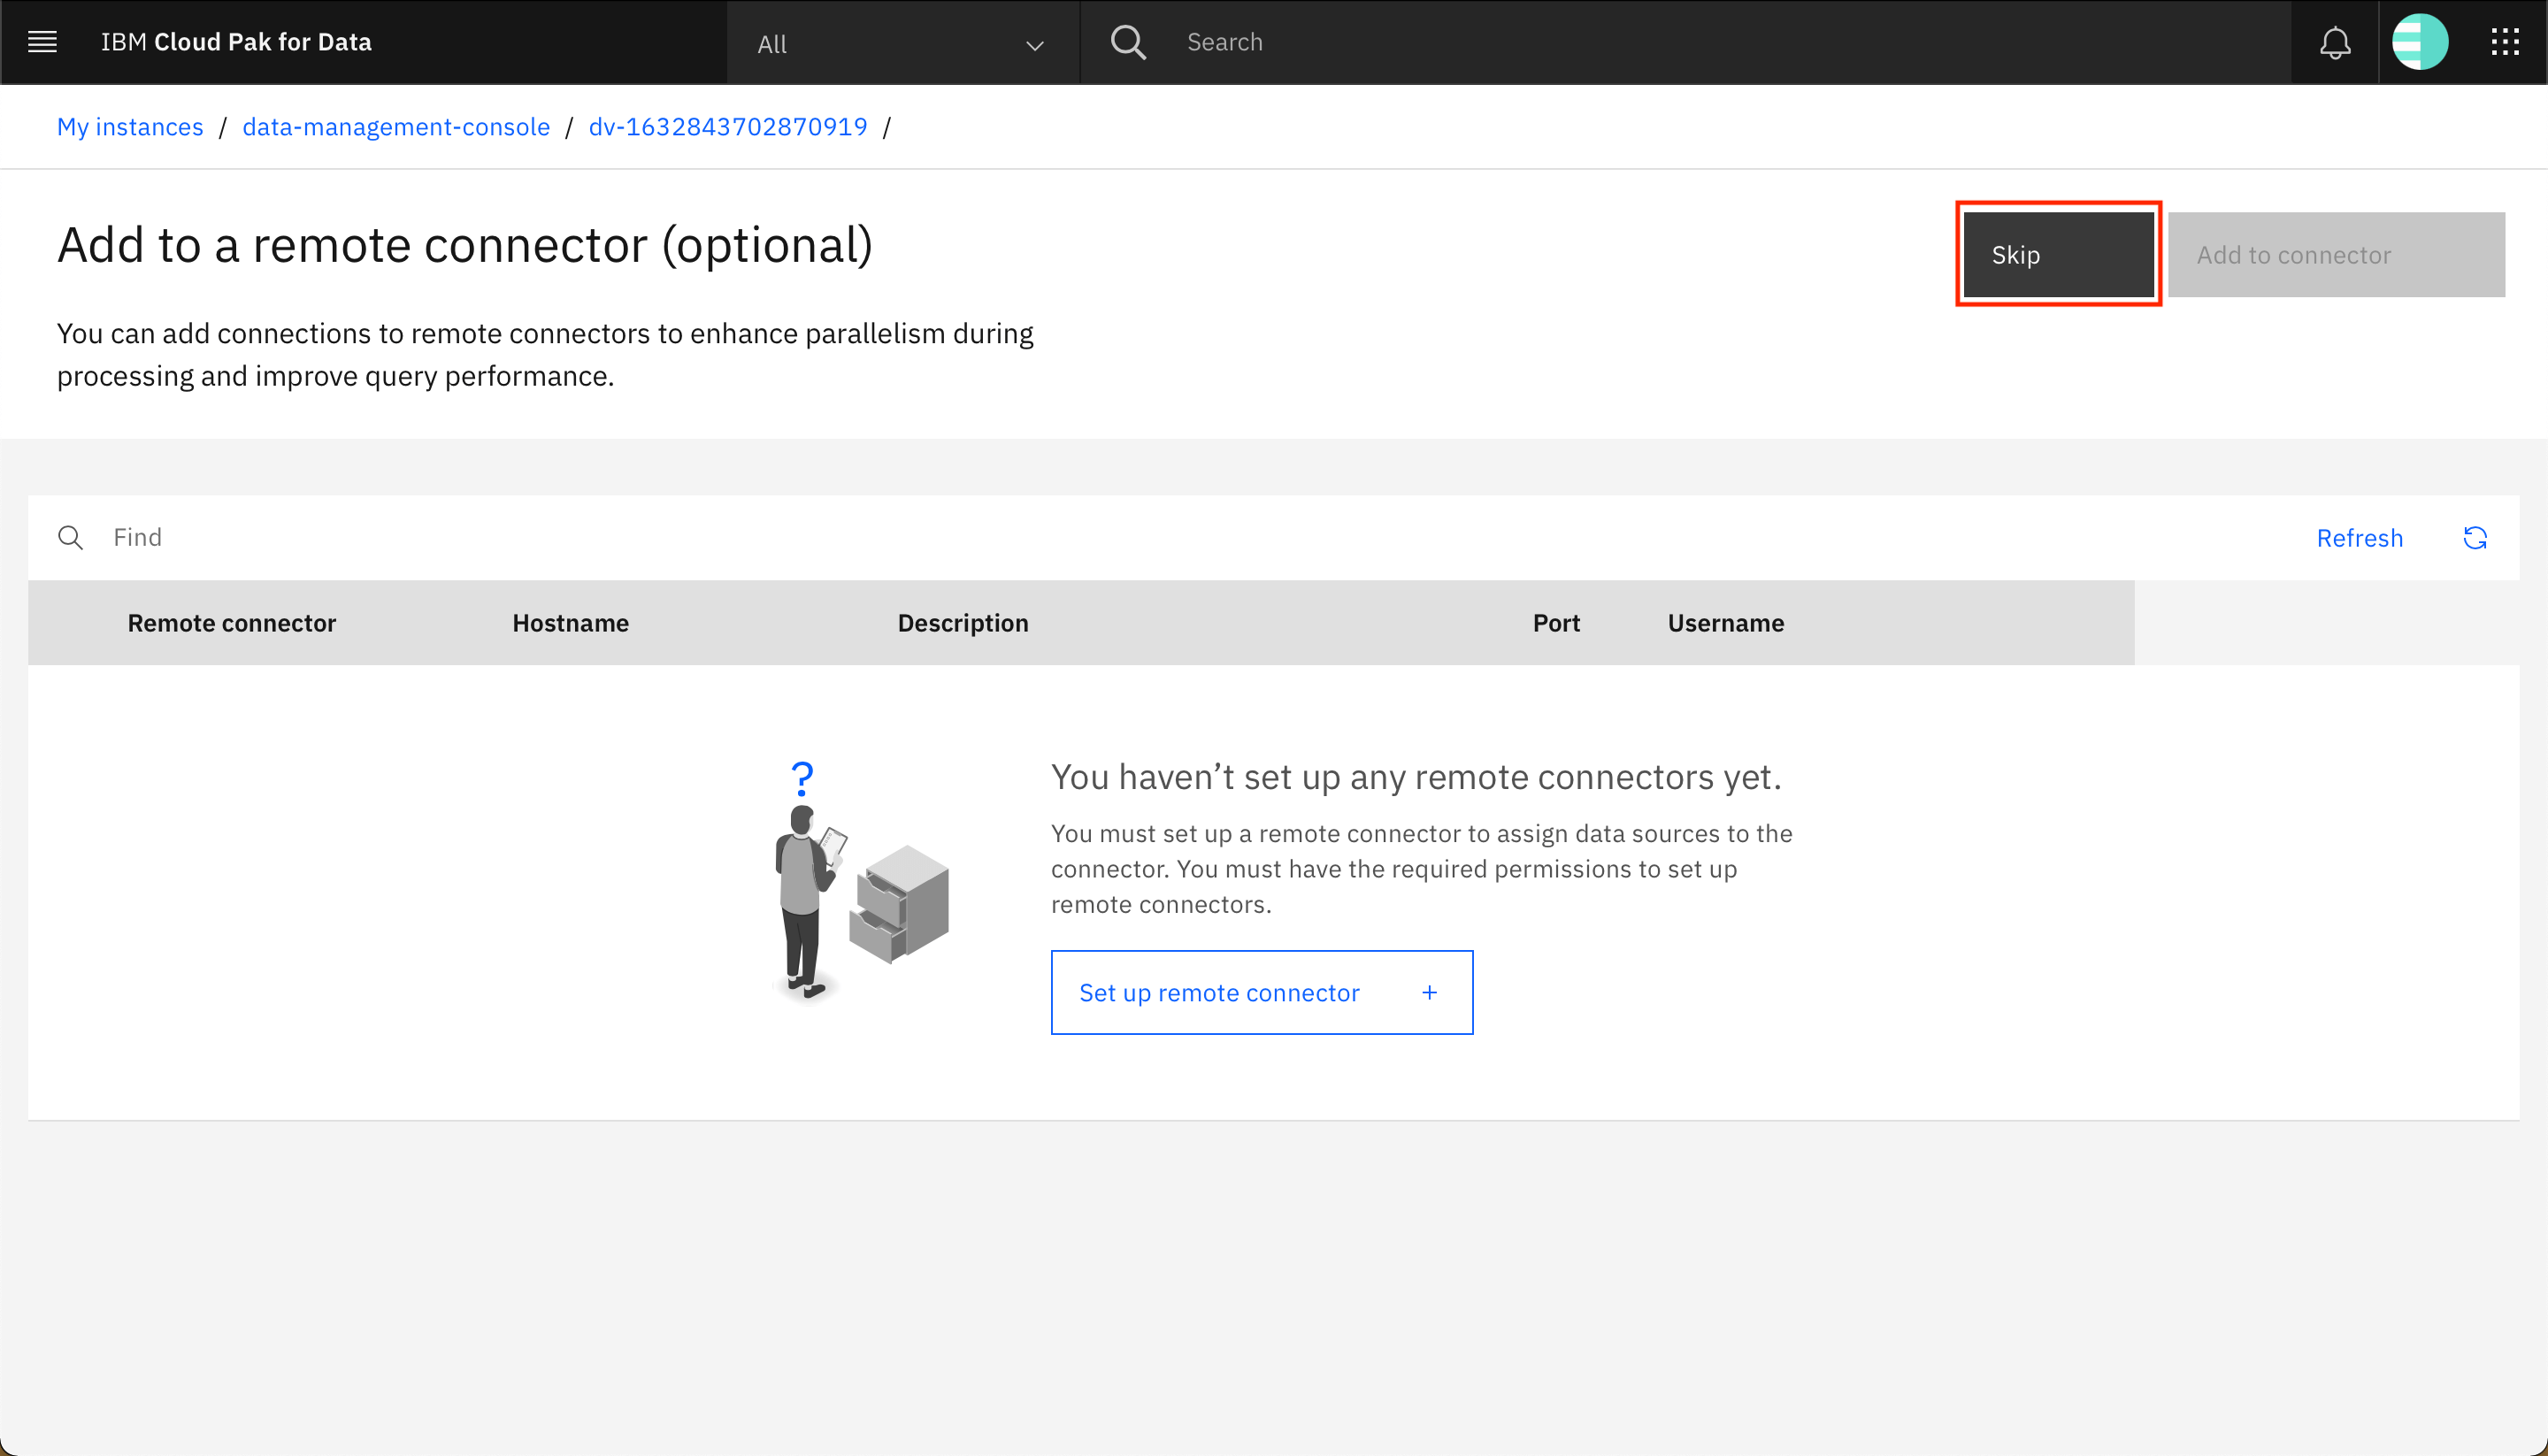
- Click skip
-
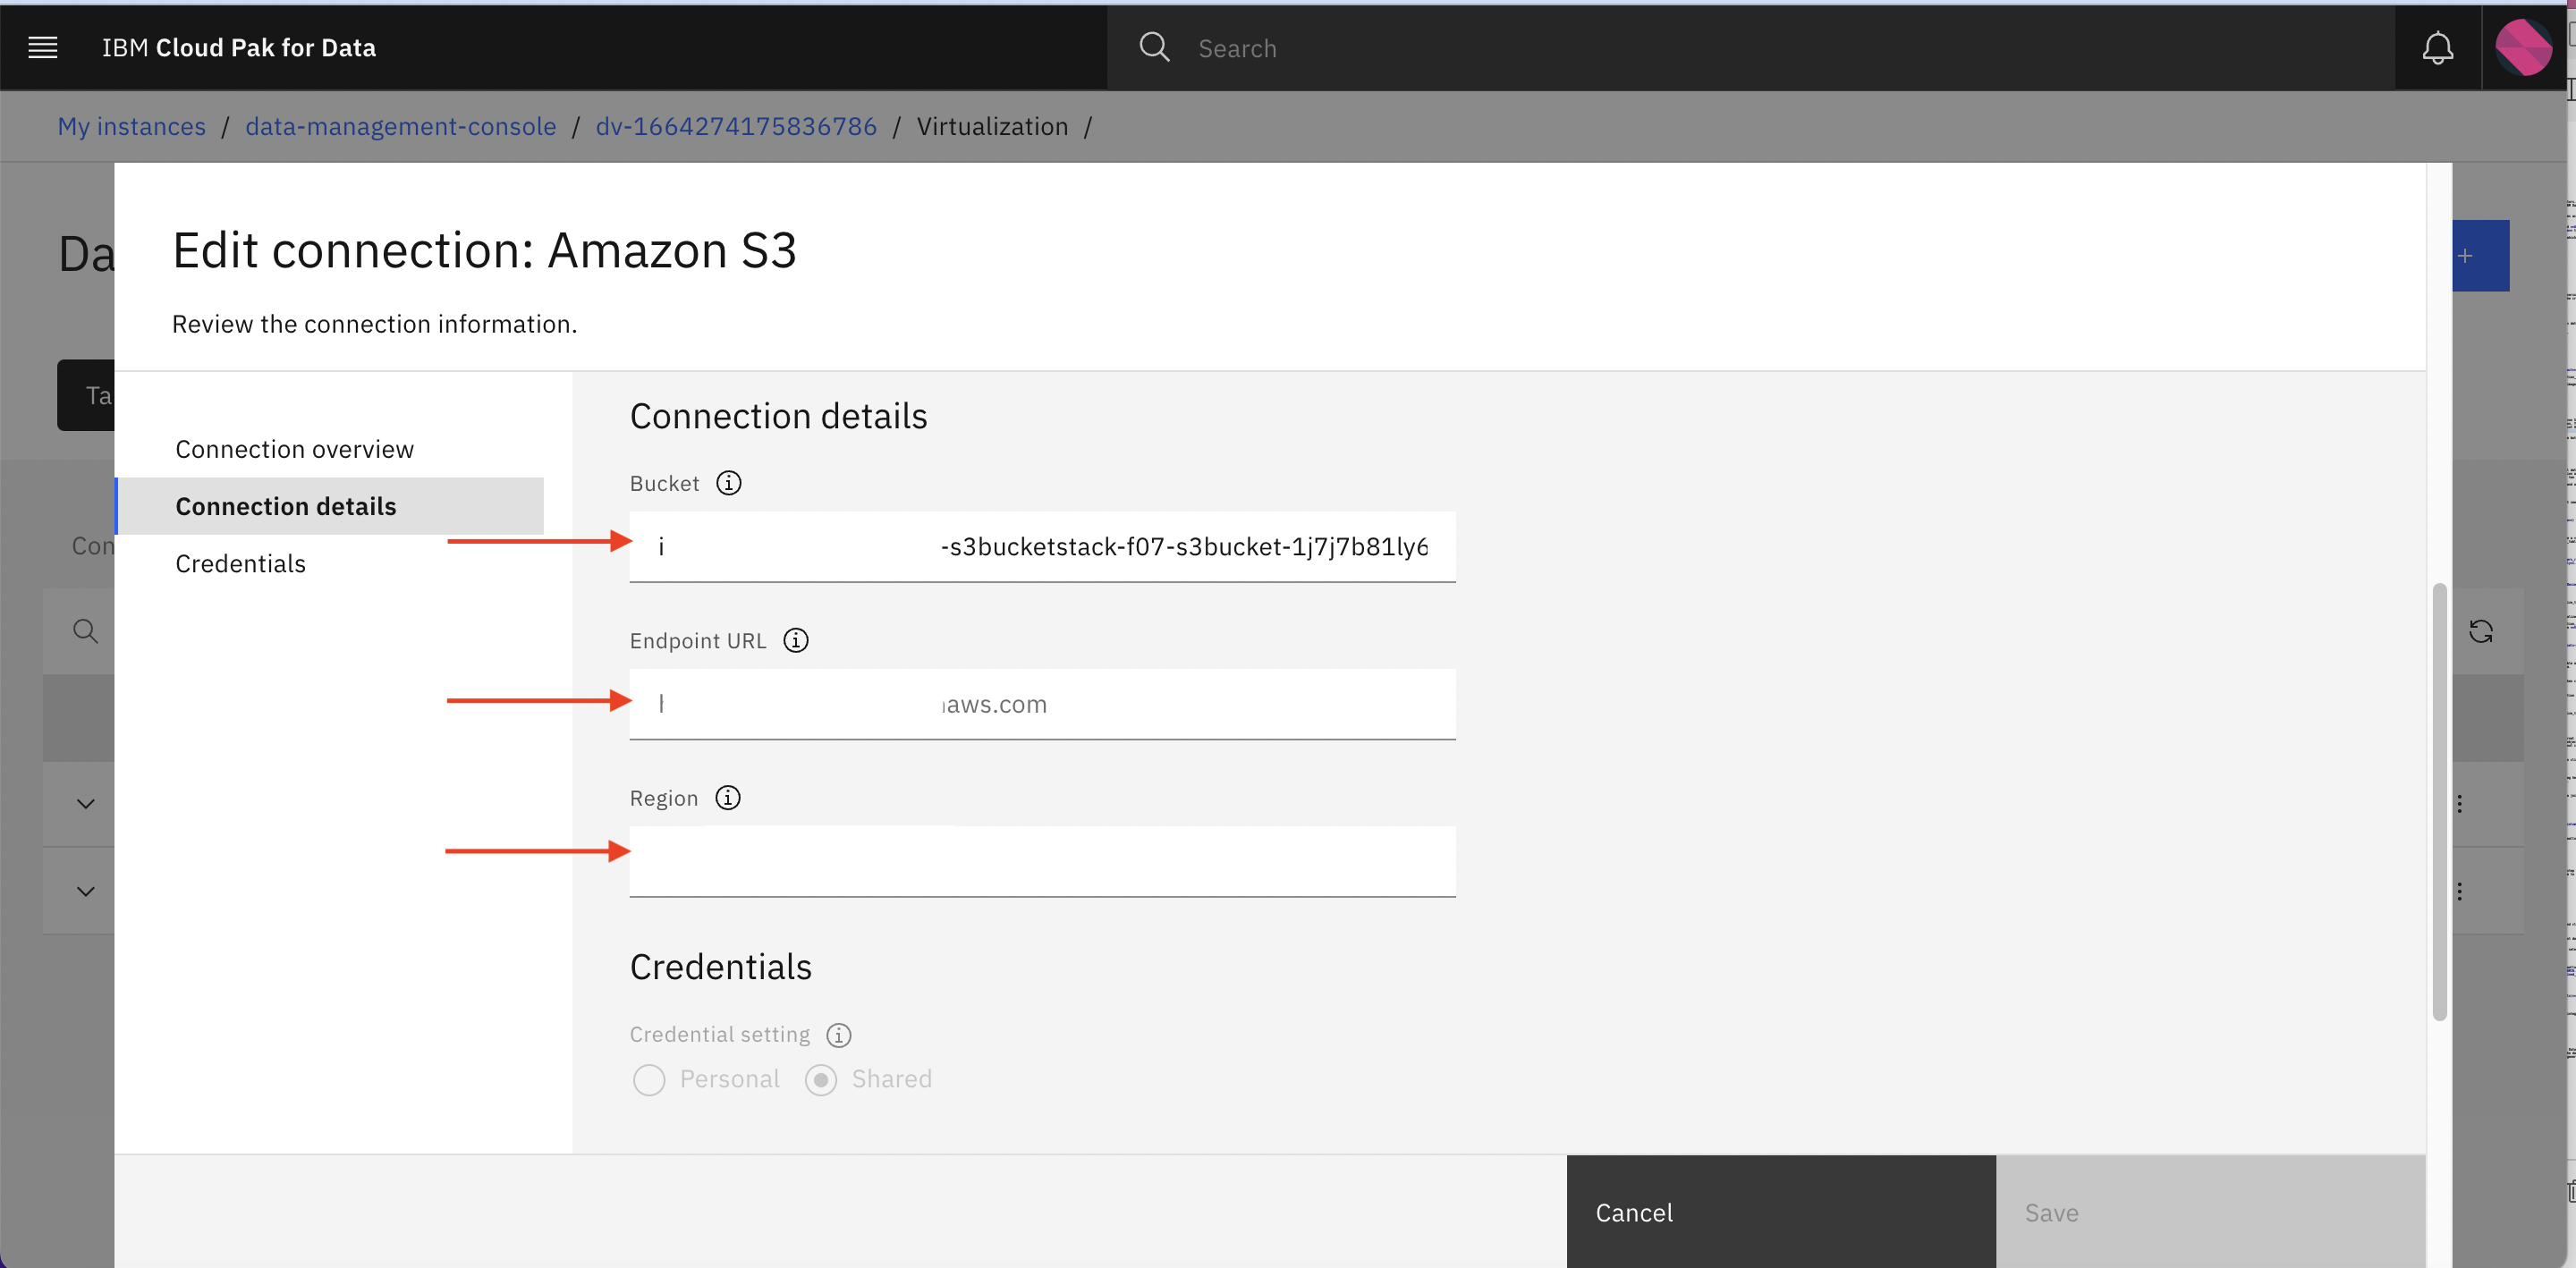
Similarly add Amazon S3 datasource by selecting connection type Amazon S3 and fill connection details provided using Infra Provisioning Lab. Similar to previous connection, You will have to specify the connection name and other required information such as Bucket, Endpoint URL, Region, Credentials (Shared, Basic).
-
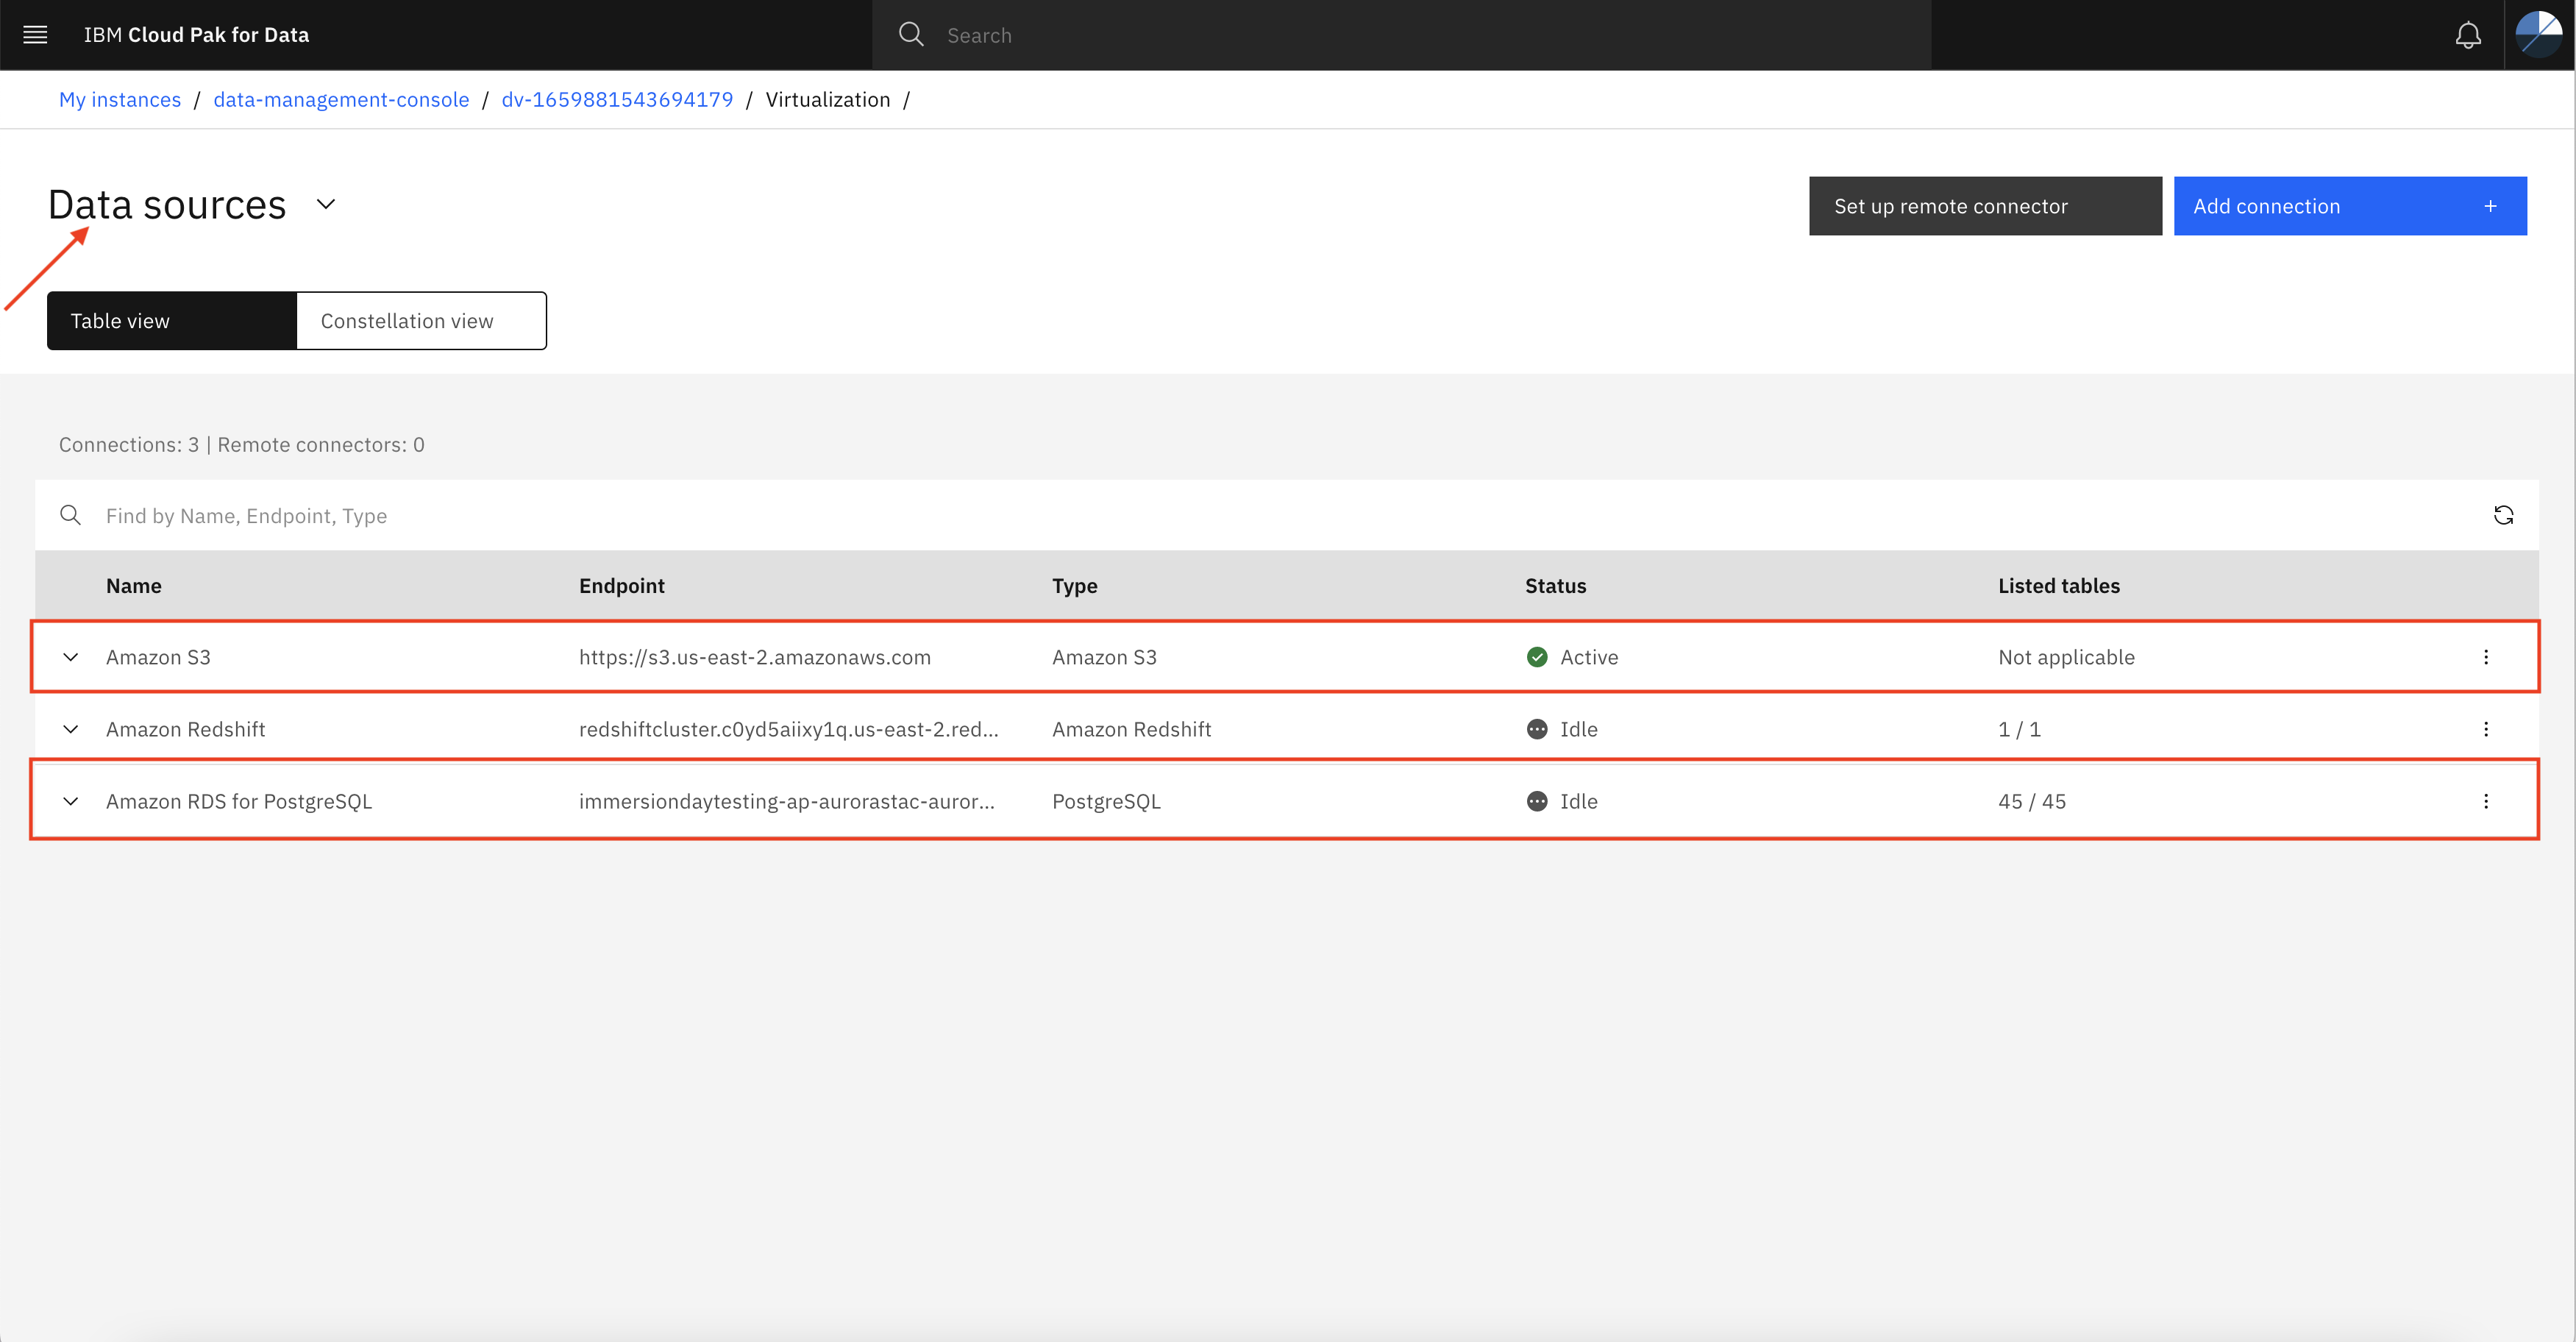
Once you create both data sources connection successfully, you should see both Amazon S3 and Amazon RDS PostgreSQL connection listed on the Data sources page as shown below.
Step 3: Create virtual tables
Congratulations!
In the previous step you have successfully created connection between external data sources and Data Virtualization service. Now you can select tables and file from the connection and create virtualized tables or objects. Once tables are virtualized you can create a VIEW by joining two virtual tables.
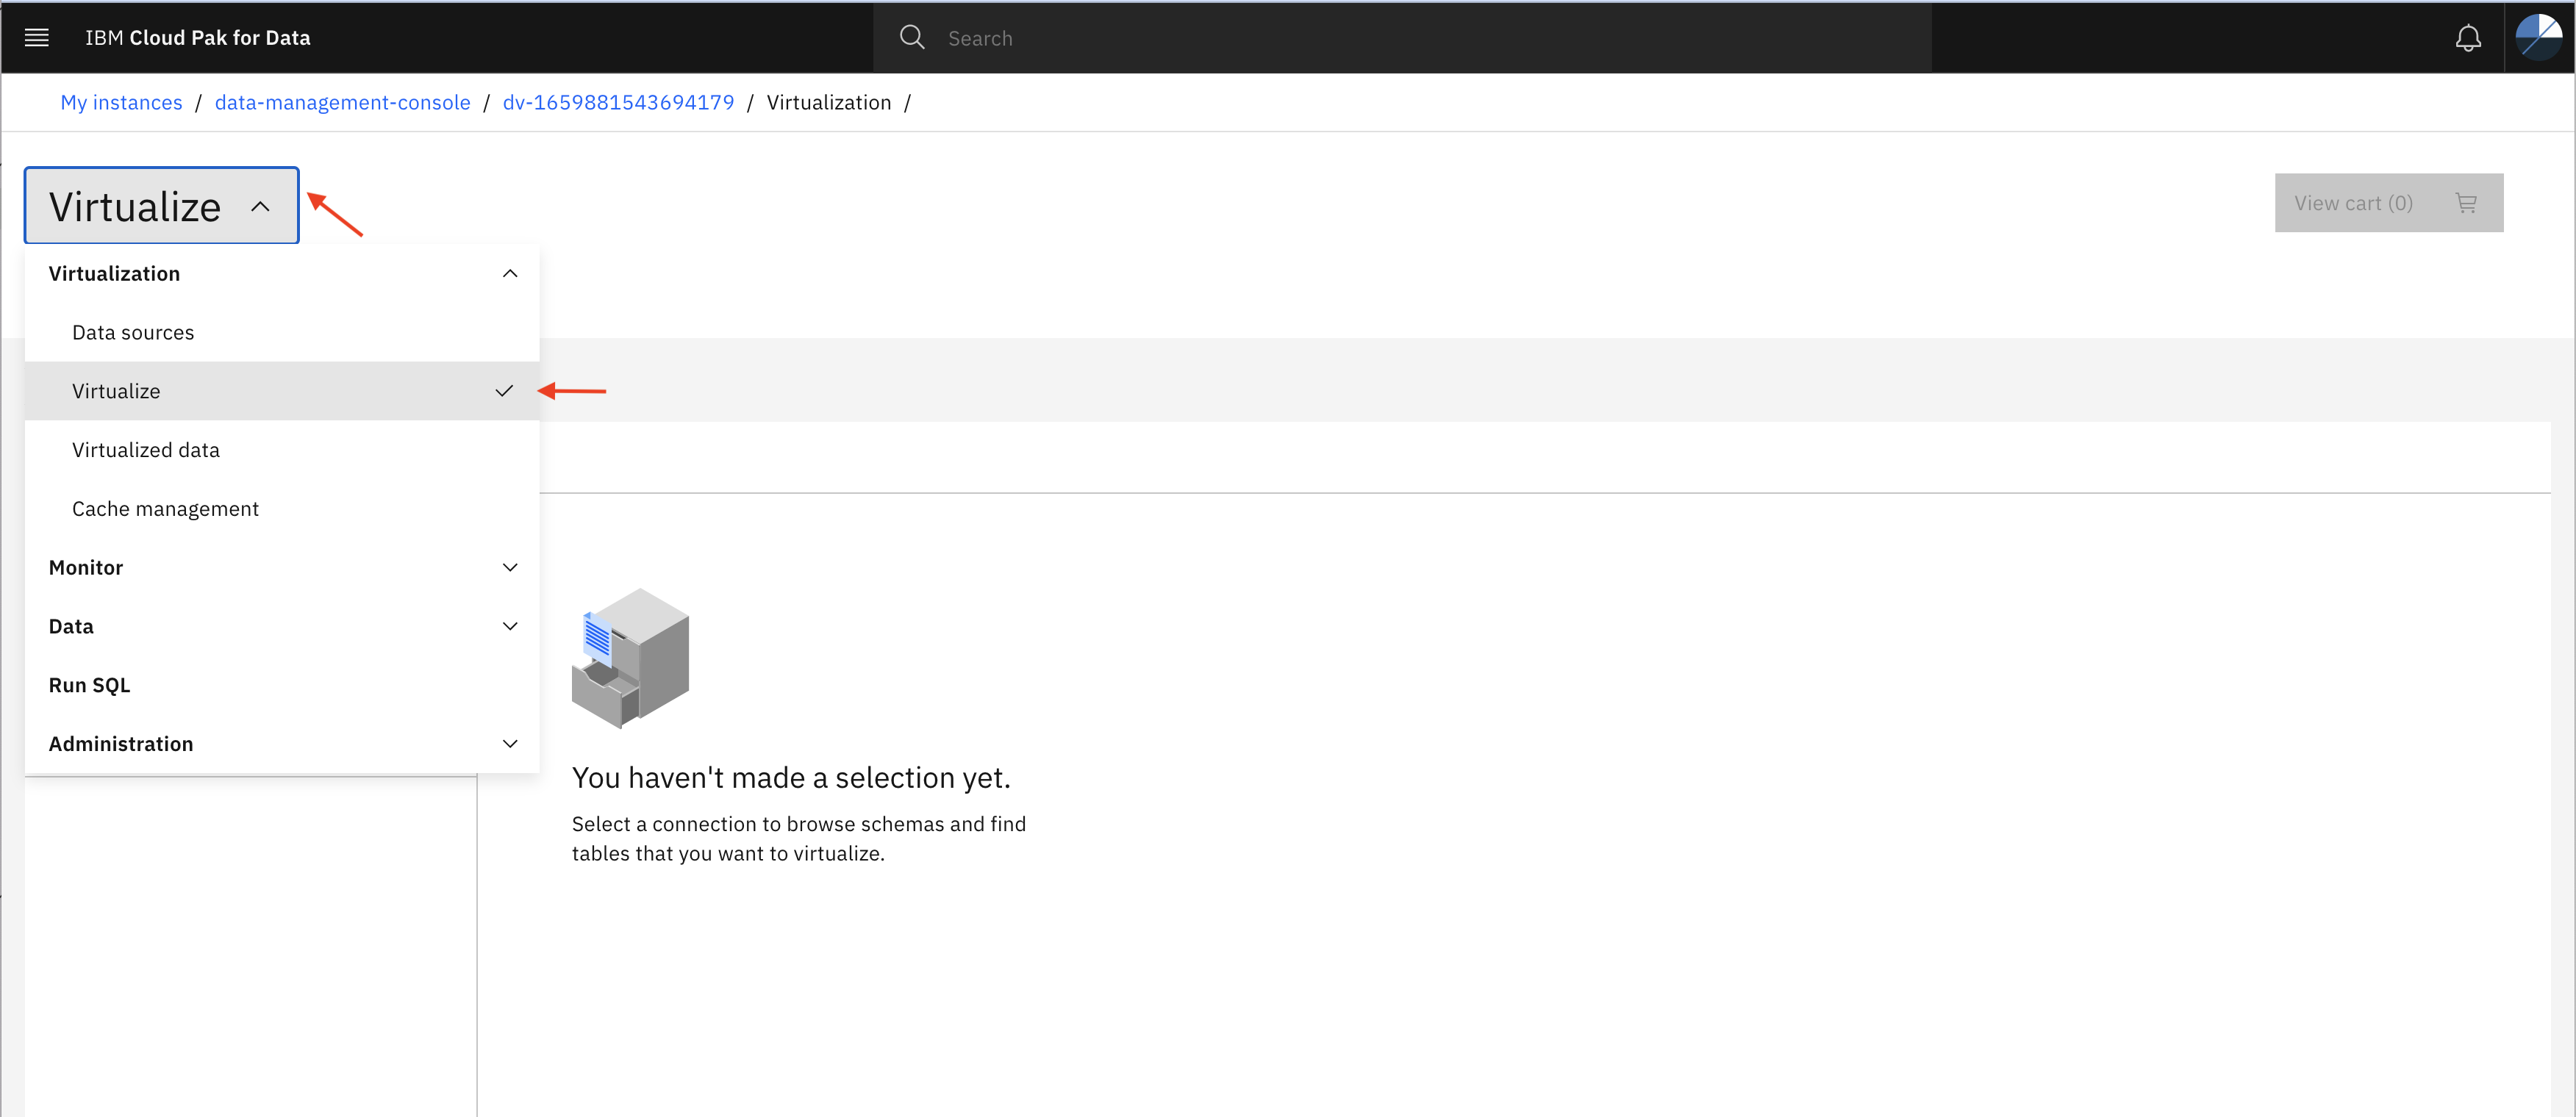
- Open the Data Virtualization menu and click on Virtualization to expand and then click Virtualize as shown below.
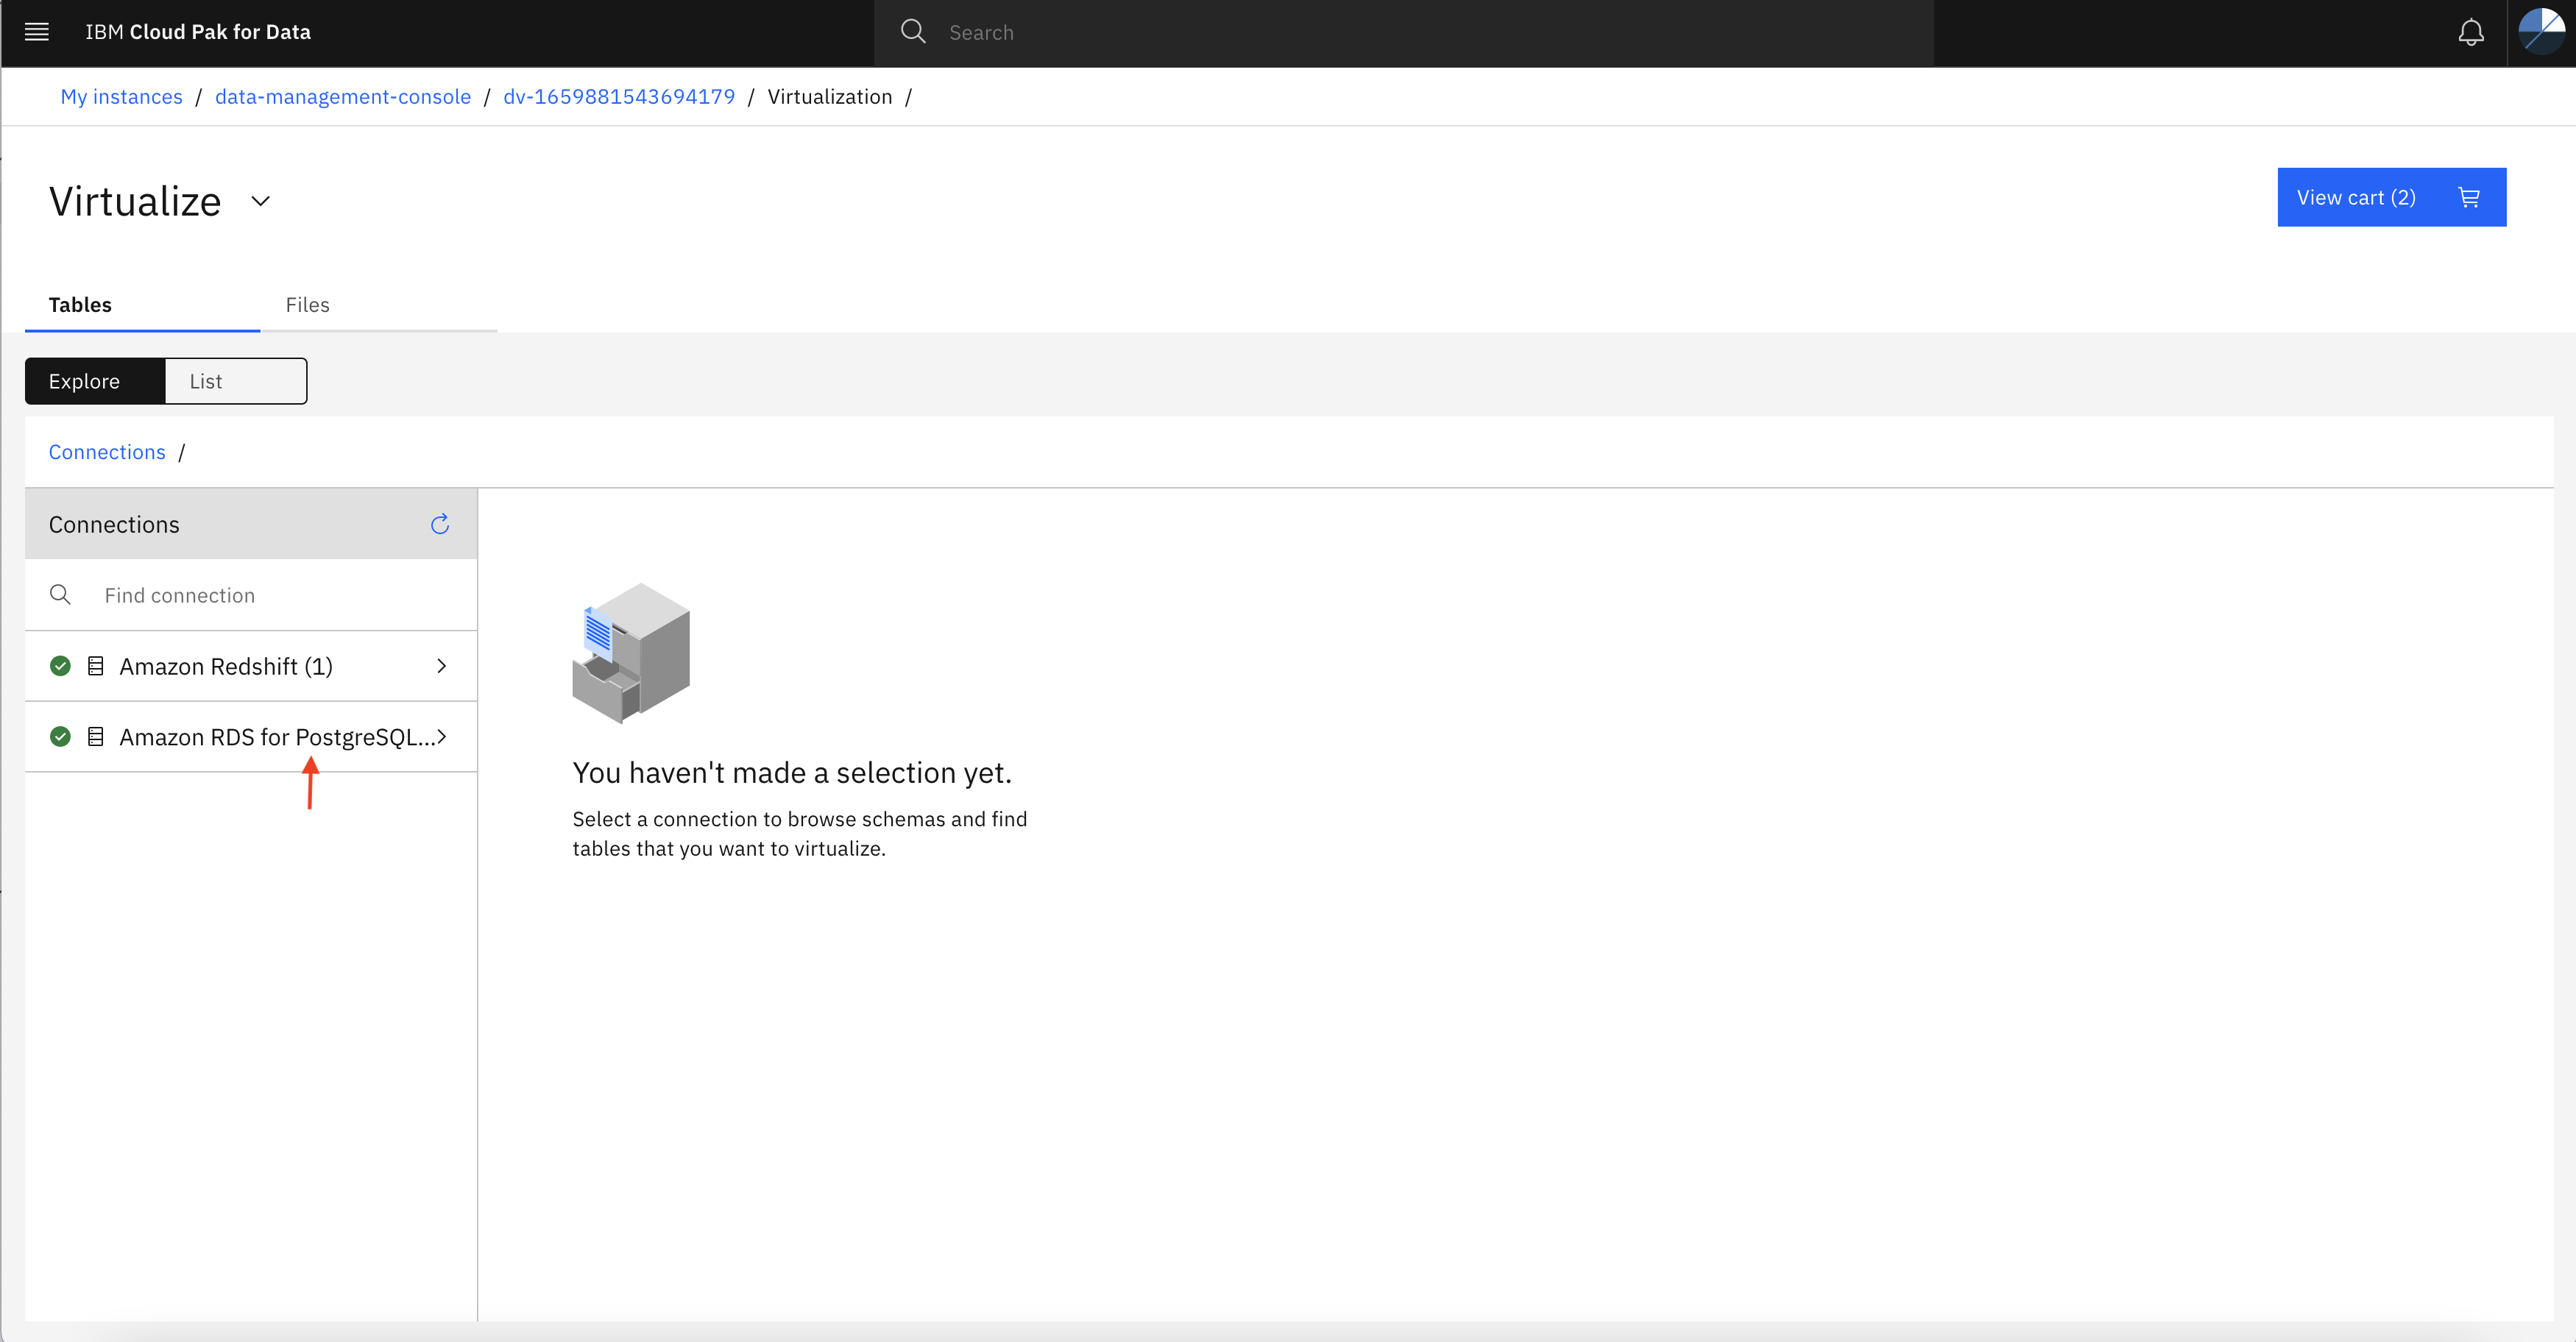
- Click on connection (eg Amazon RDS for PostgreSQL) and then you might see several tables under public schema.
If there are multiple connections listed, choose only one which you have created in previous step.
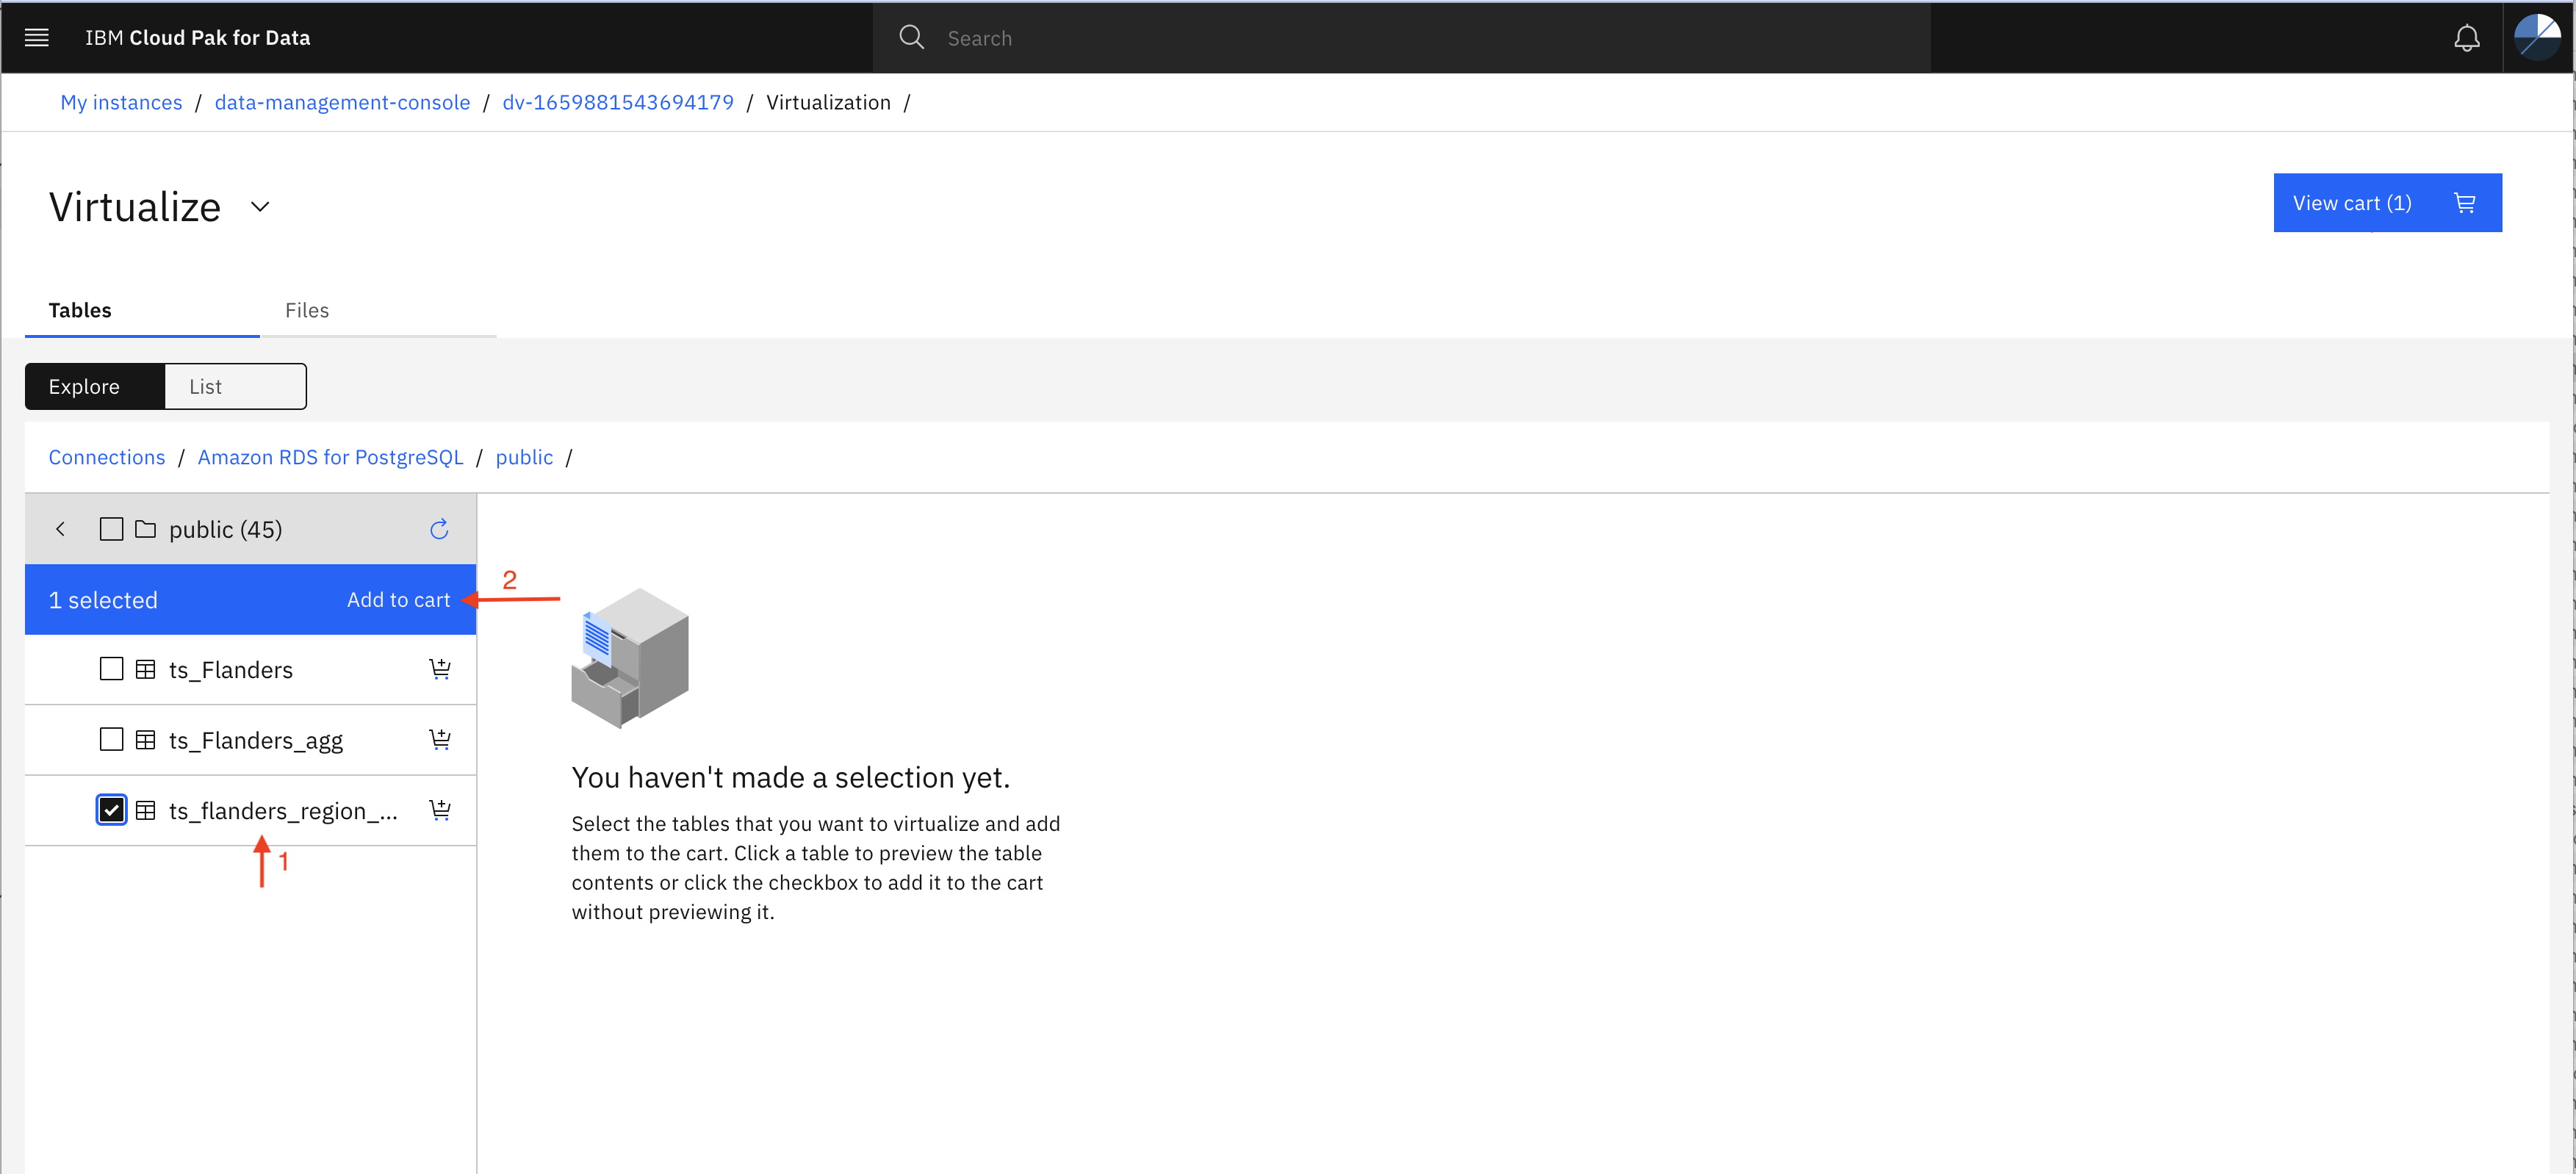
Select the tables (ts_wallonia_region_table and ts_flanders_region_table) one by one and then click Add to cart. Once after adding both the tables to the cart, click View cart.
- As shown in this screen, Select the Virtualize Data option and provide a unique name to table (in the image below names are ts_wallonia_region_table and ts_flanders_region_table).
You might need tables name in the next step. so, note it down for future reference.
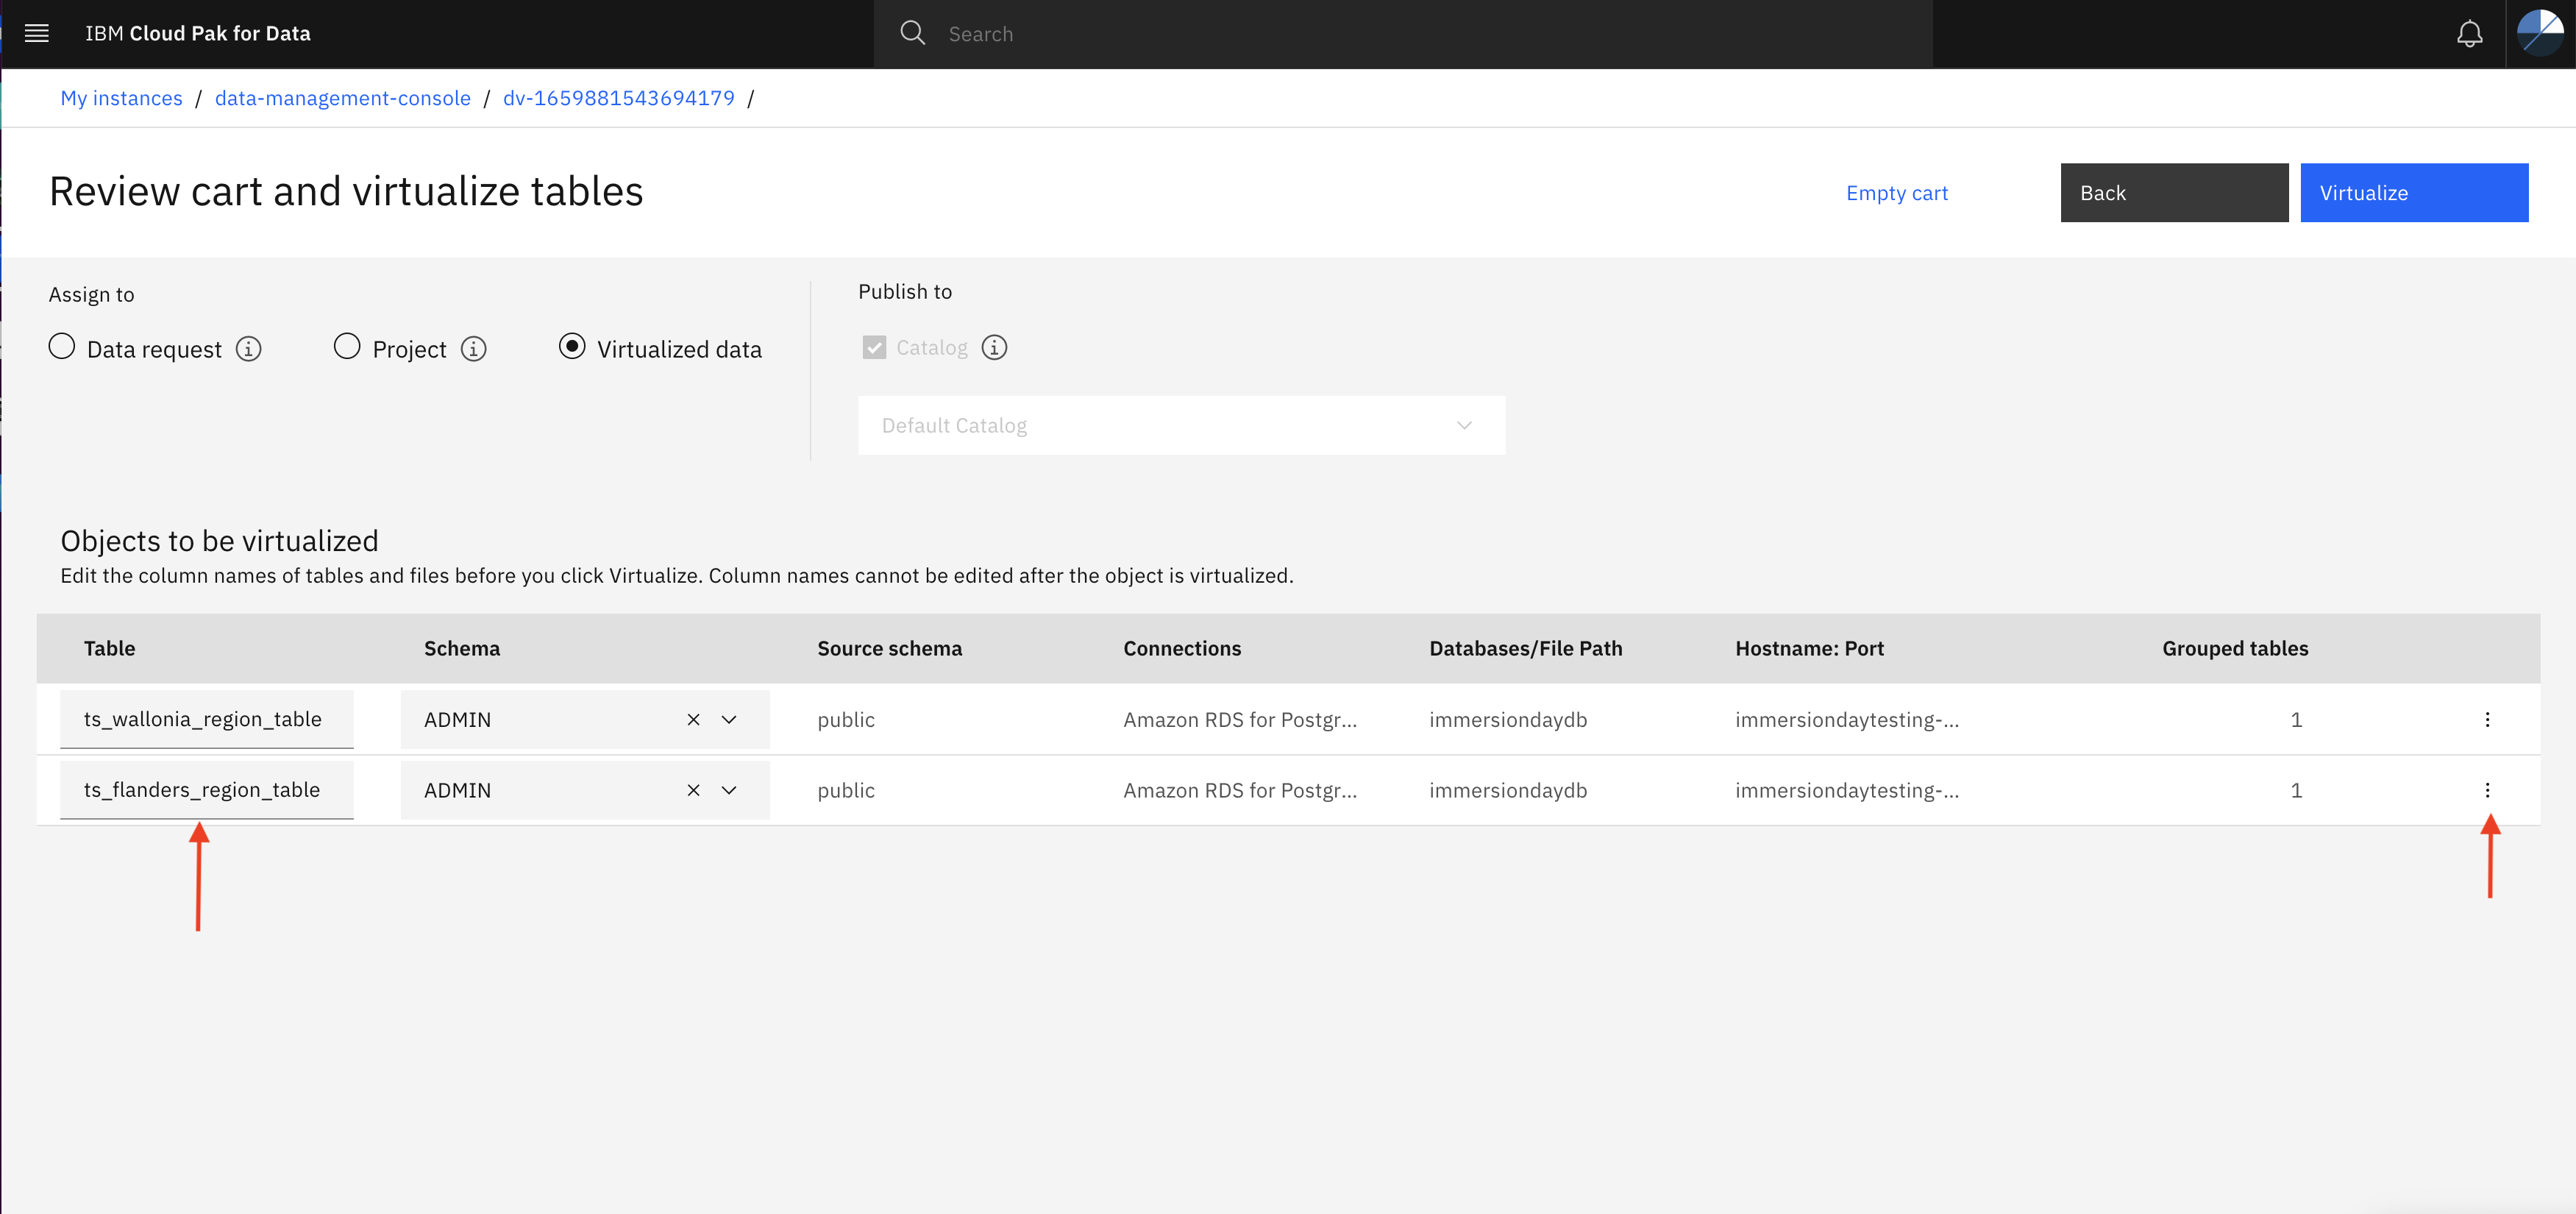
Now click on three dots and then click Edit columns option (eg ts_flanders_region_table) to verify name, type and length of the columns matches with image below and click Apply.
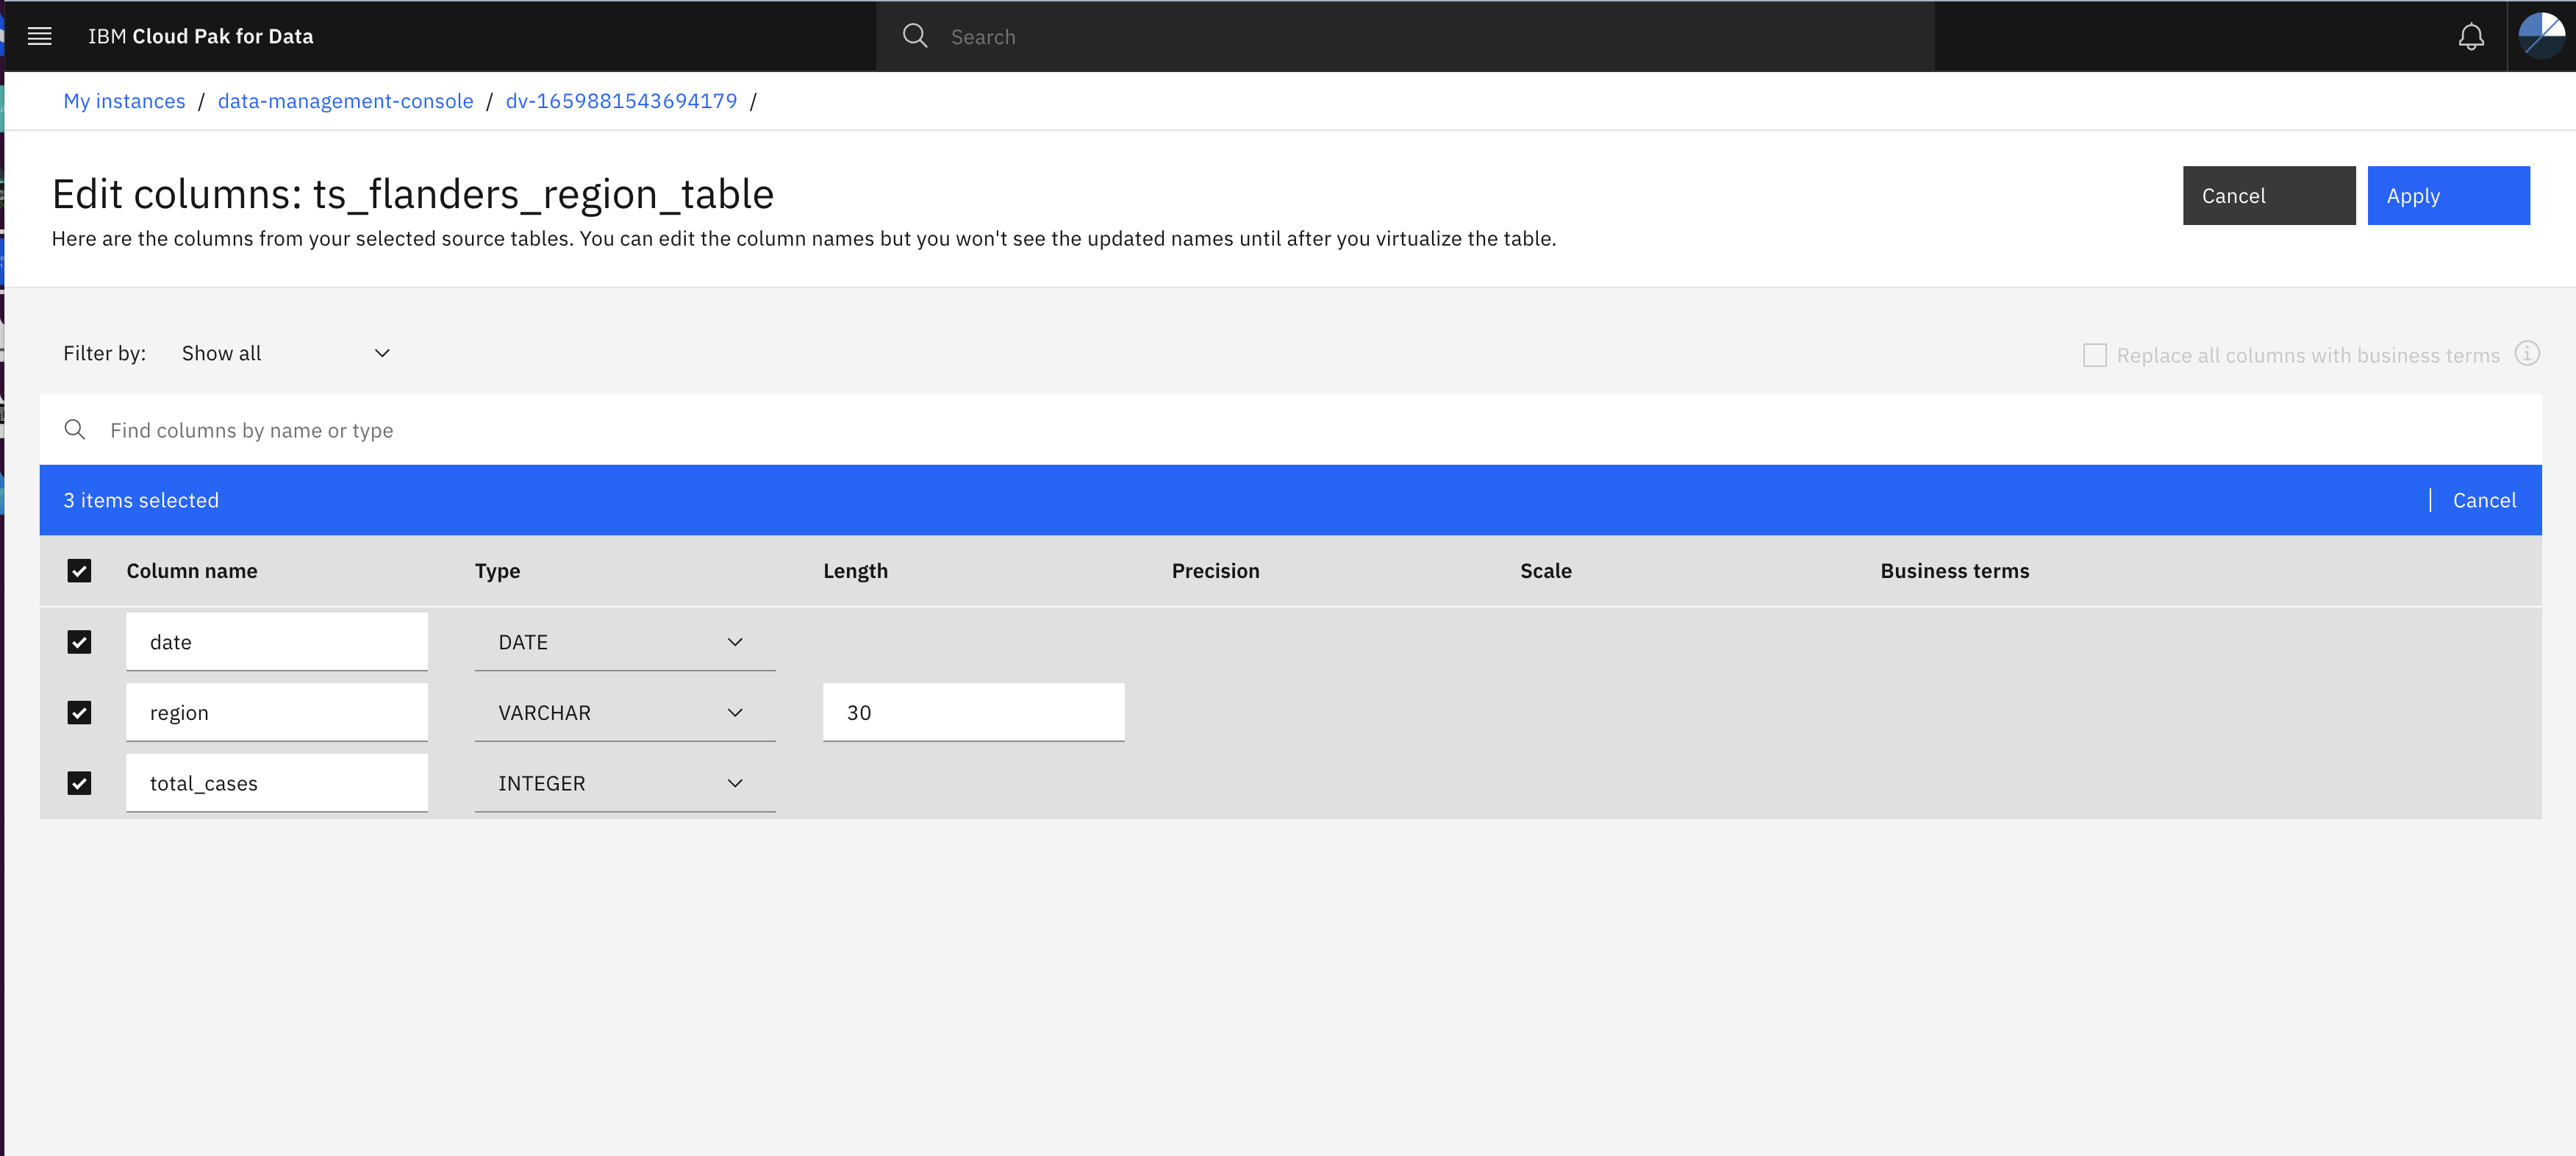
Match the column name, type and length with the above image. Otherwise you may get error while creating View.
Repeat the same step for another table (here ts_wallonia_region_table).
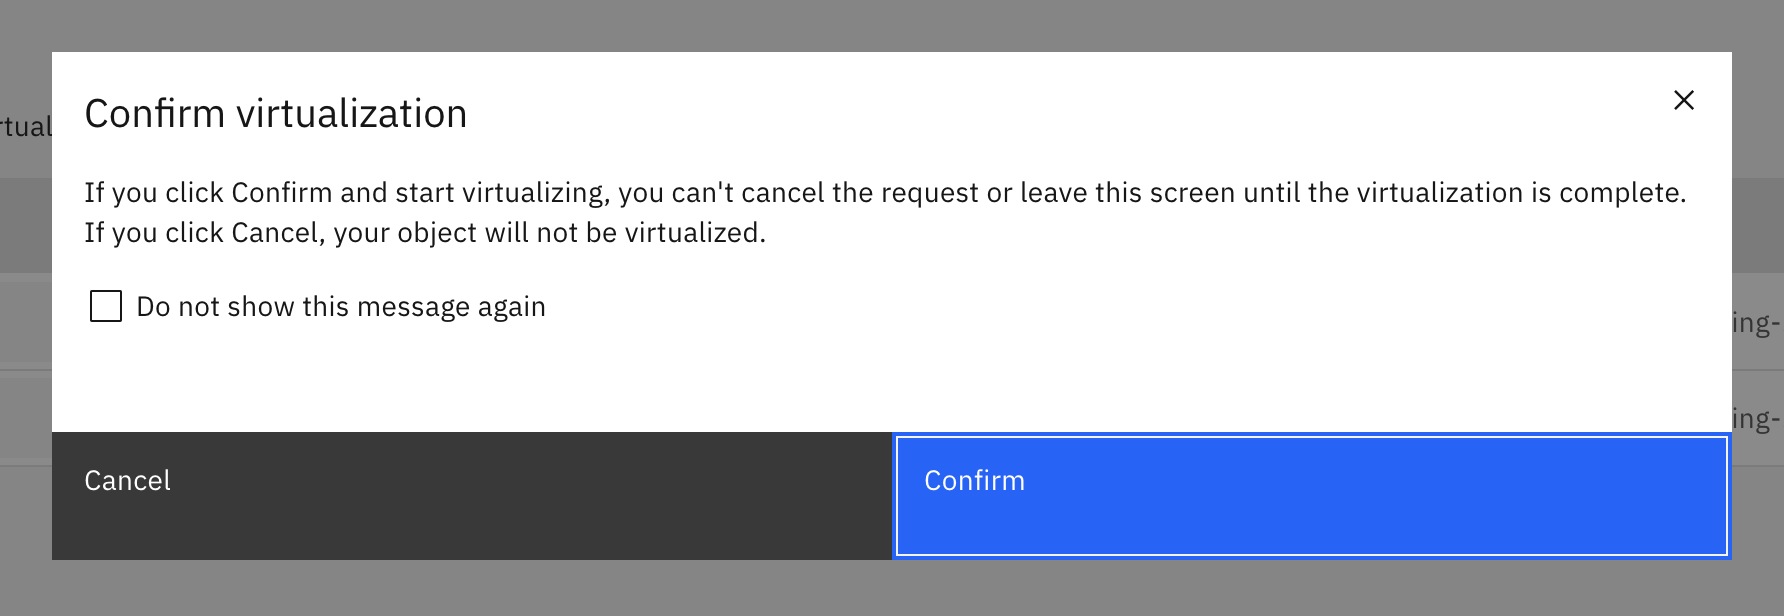
Once after making the changes click Apply and then click Virtualize in Review cart and virtualize table page.
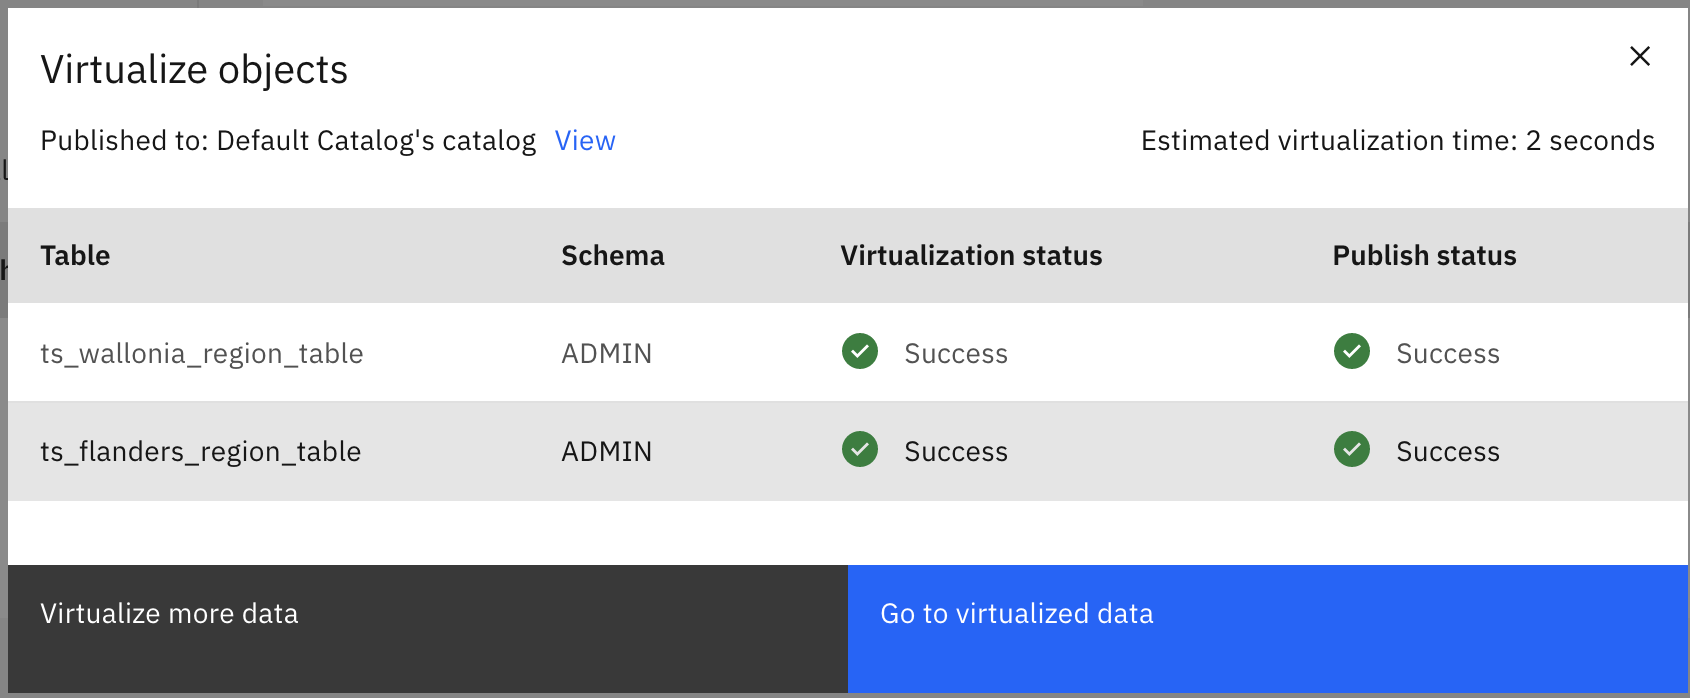
- Click Continue to create Virtual tables.
Click Virtualize more data option
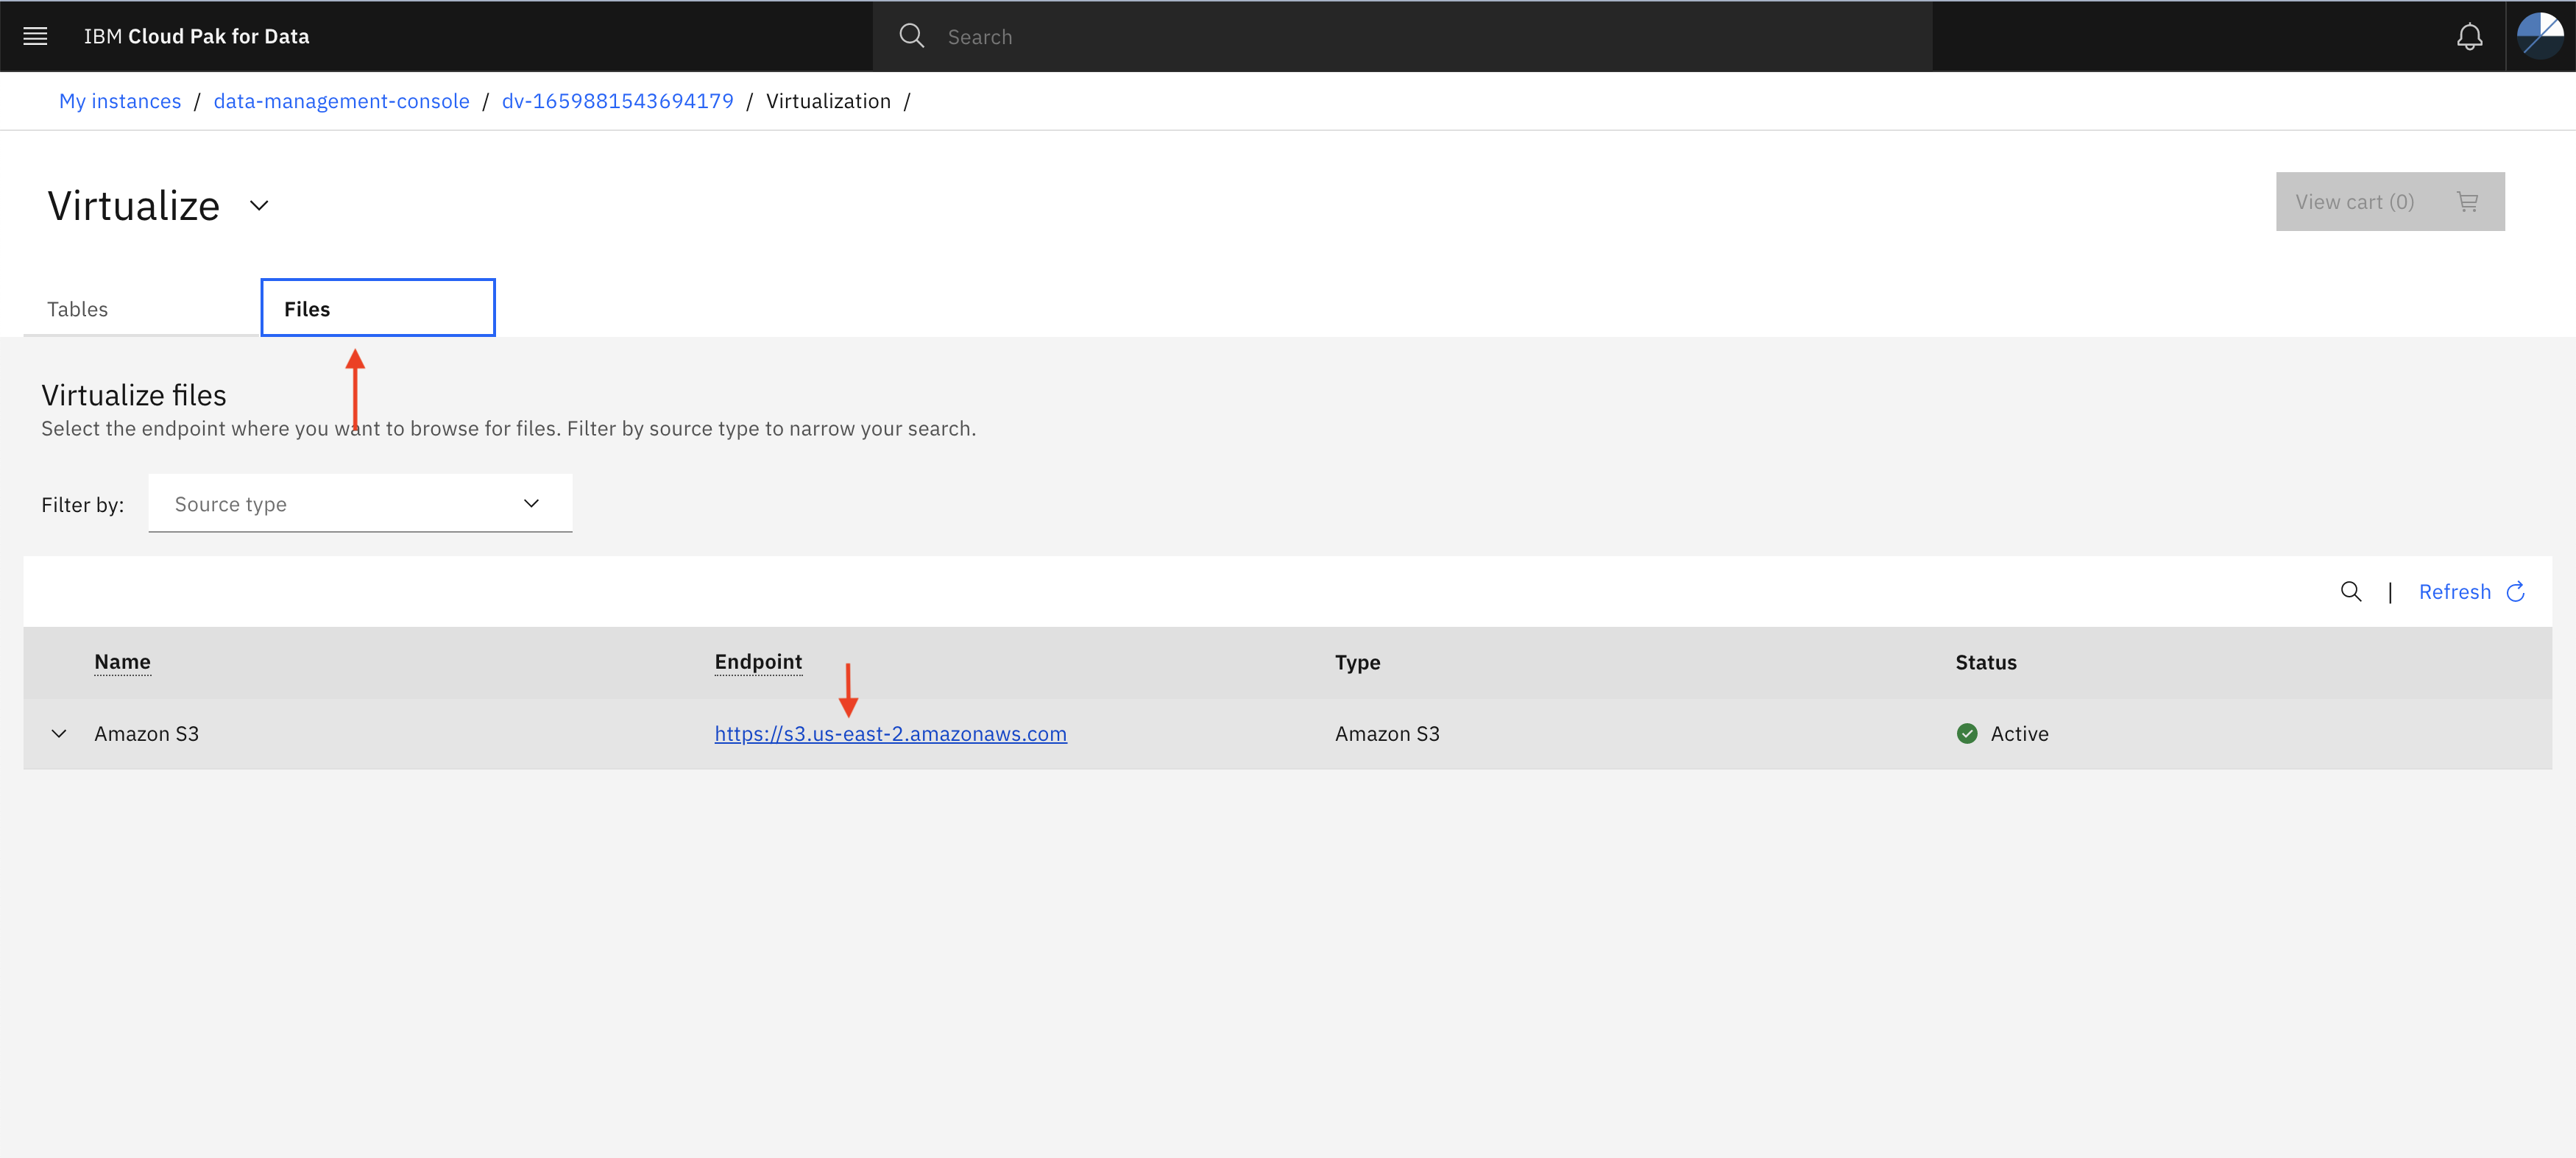
- In the last step we Virtualized the tables coming from Amazon RDS connection, now let’s use csv file coming from Amazon S3 connection and Virtualize it. Click Files tab in the Virtualize page as shown below and then click Endpoint
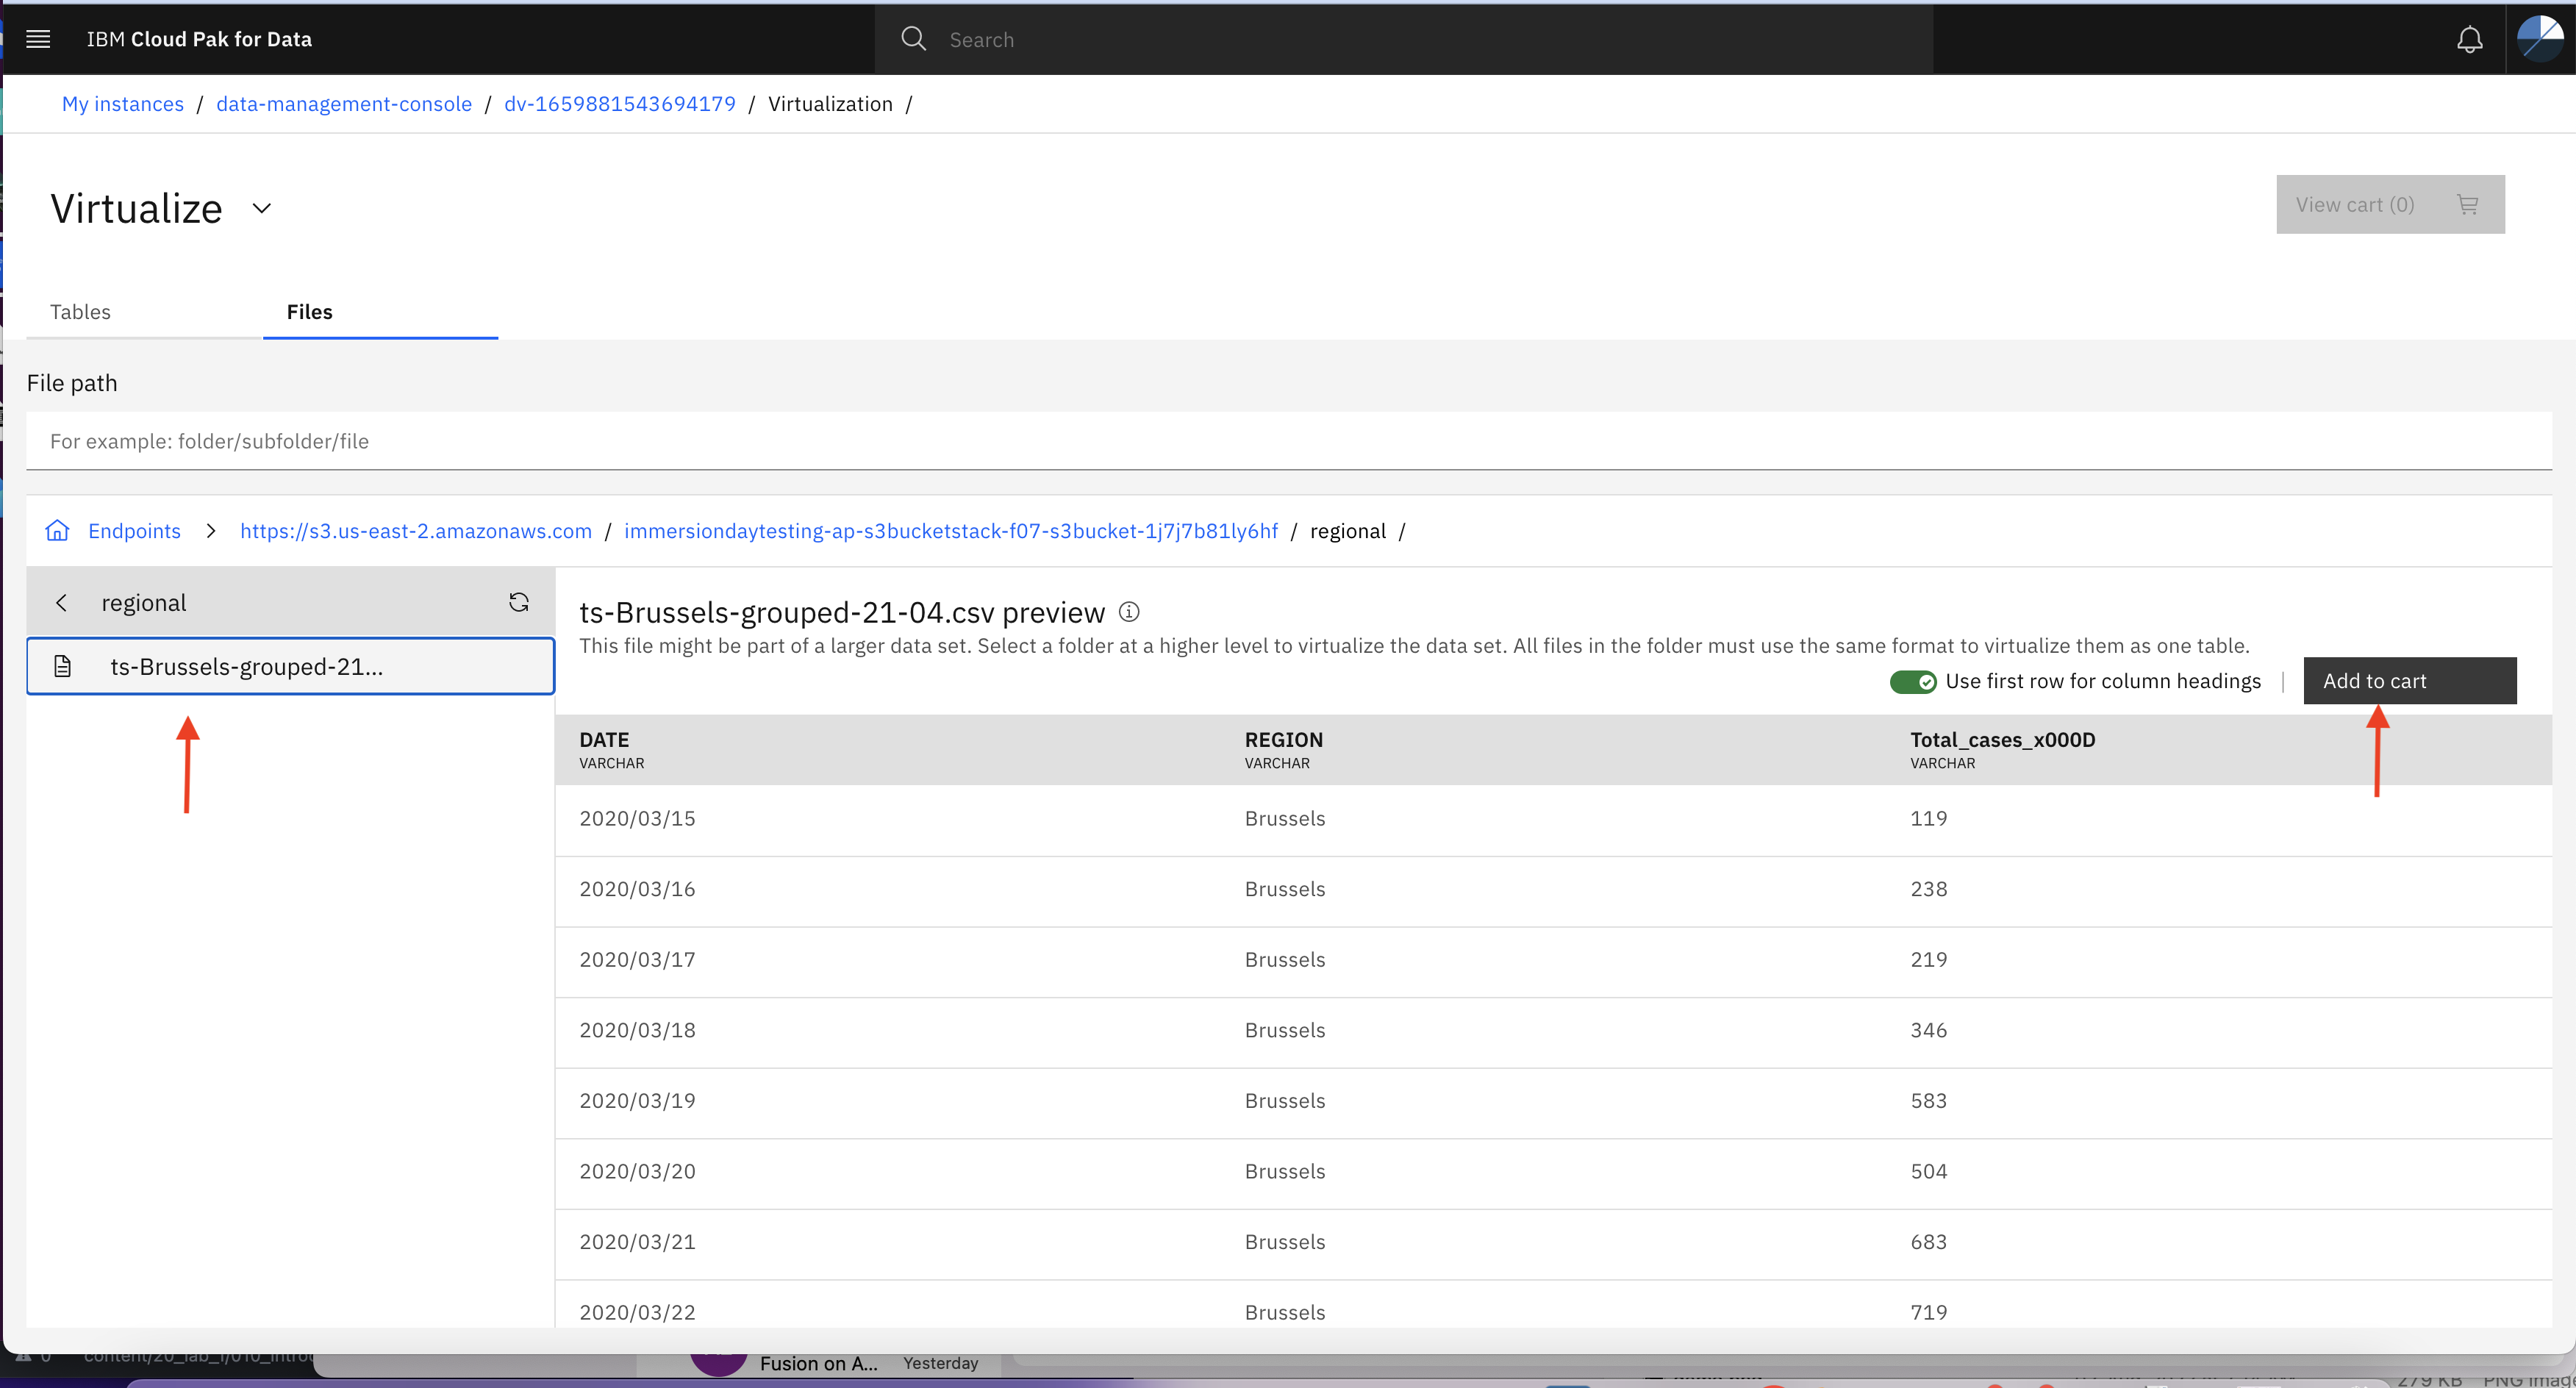
- Navigate to regional folder inside parent bucket and select ts-Brussels-grouped-21-04.csv as shown in below image and then click Add to cart then View Cart
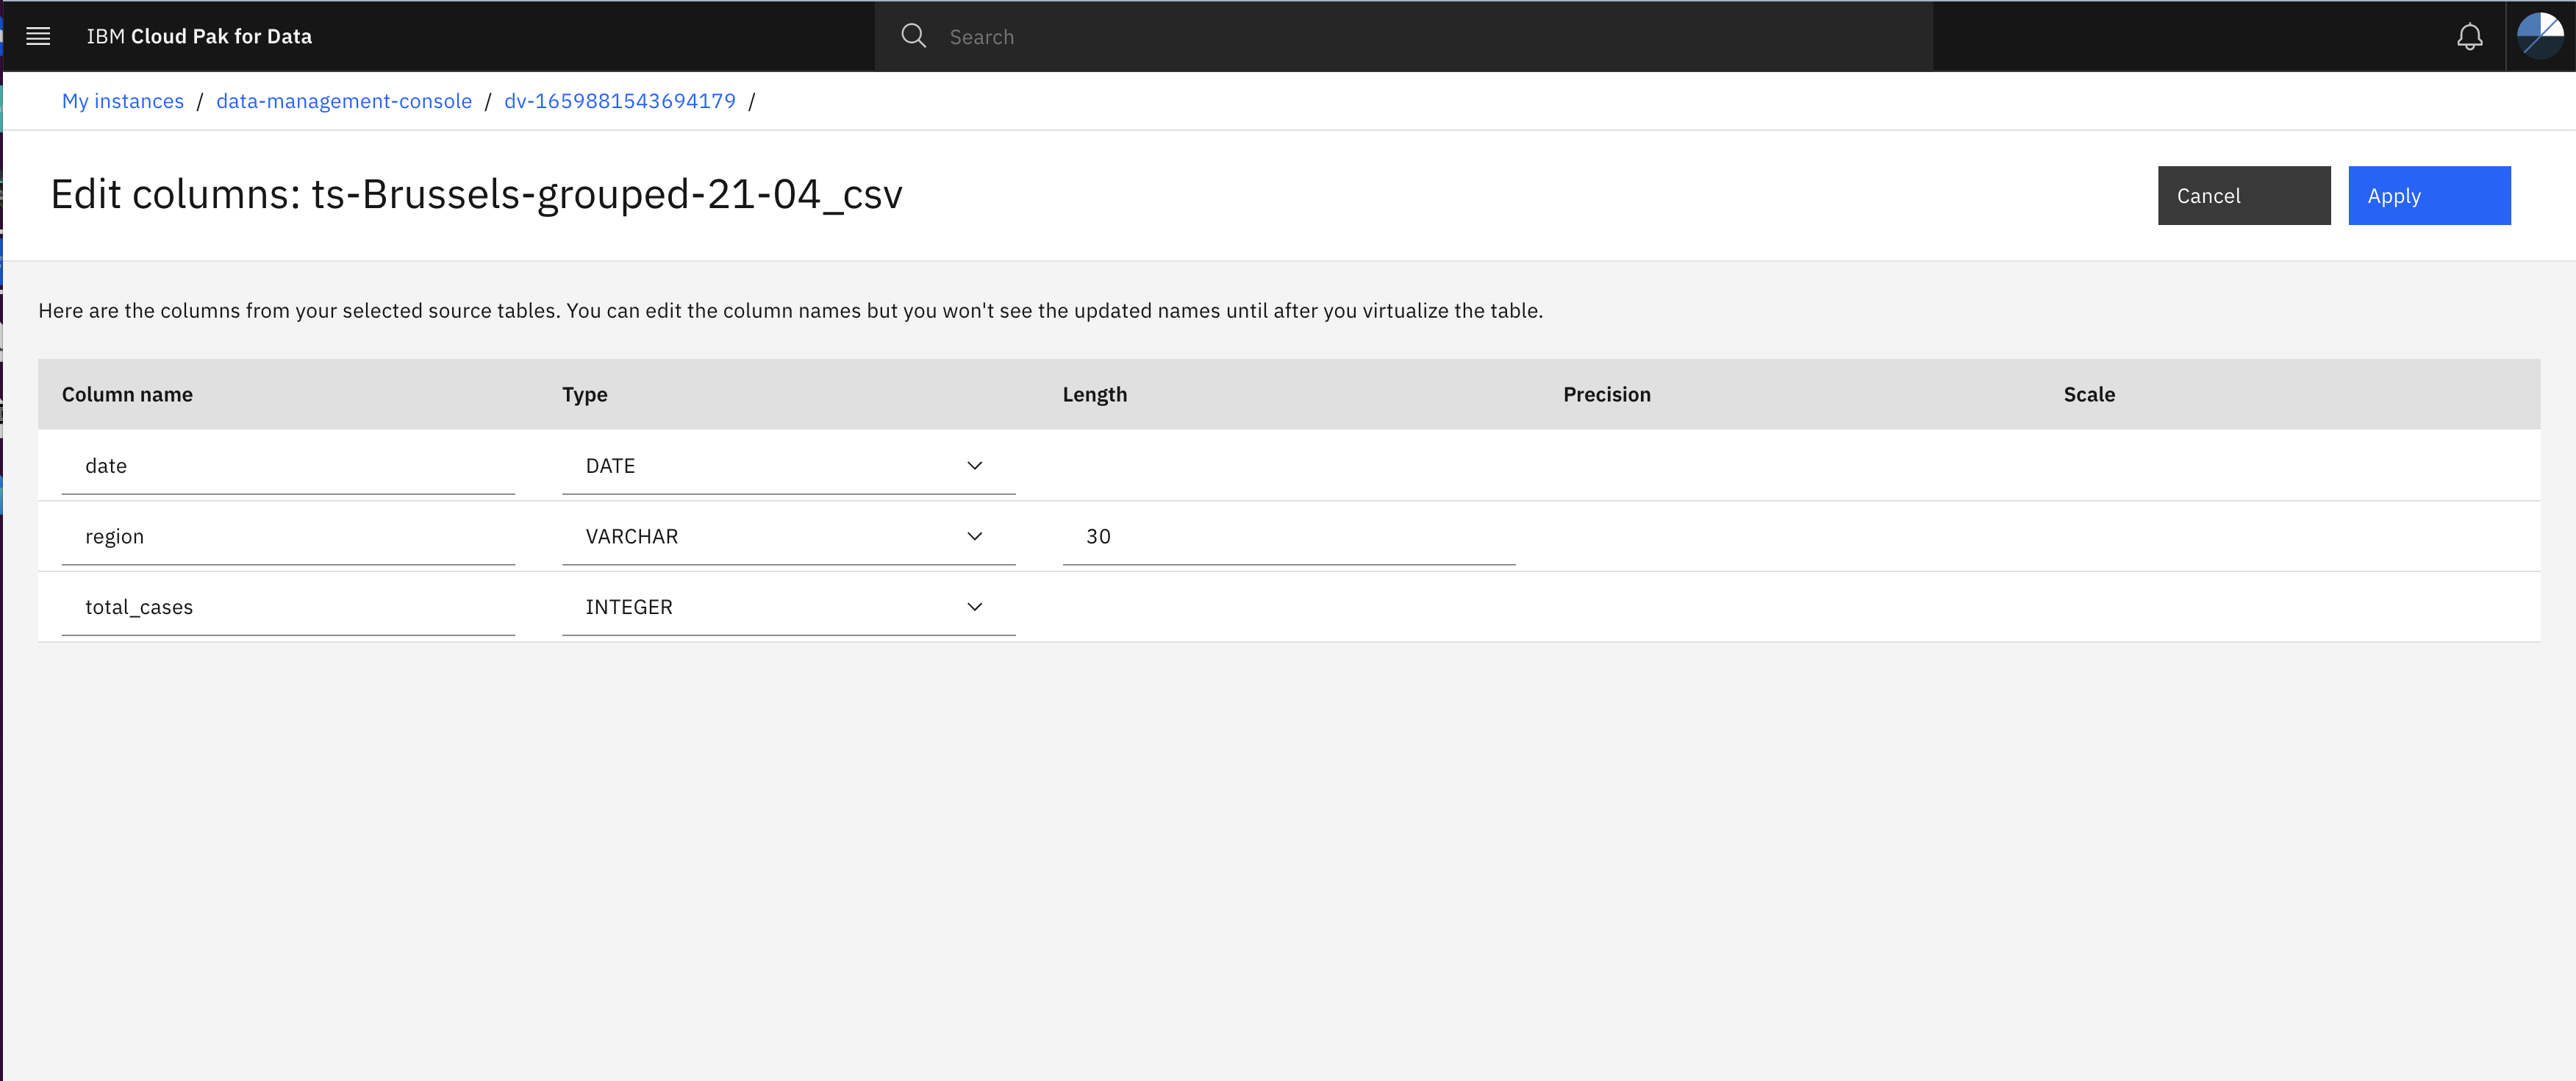
- In the Review cart and virtualize page specify unique name to the table and note it down for future reference, and then click Modify columns button to review columns metadata.

- Edit the column name, type, and length as shown in below image and then click Apply
Match the column name, type and length with the below image. Otherwise you may get error while creating View.
-
In the Review cart and virtualize page check Virtualized data option then click Virtualize button.
-
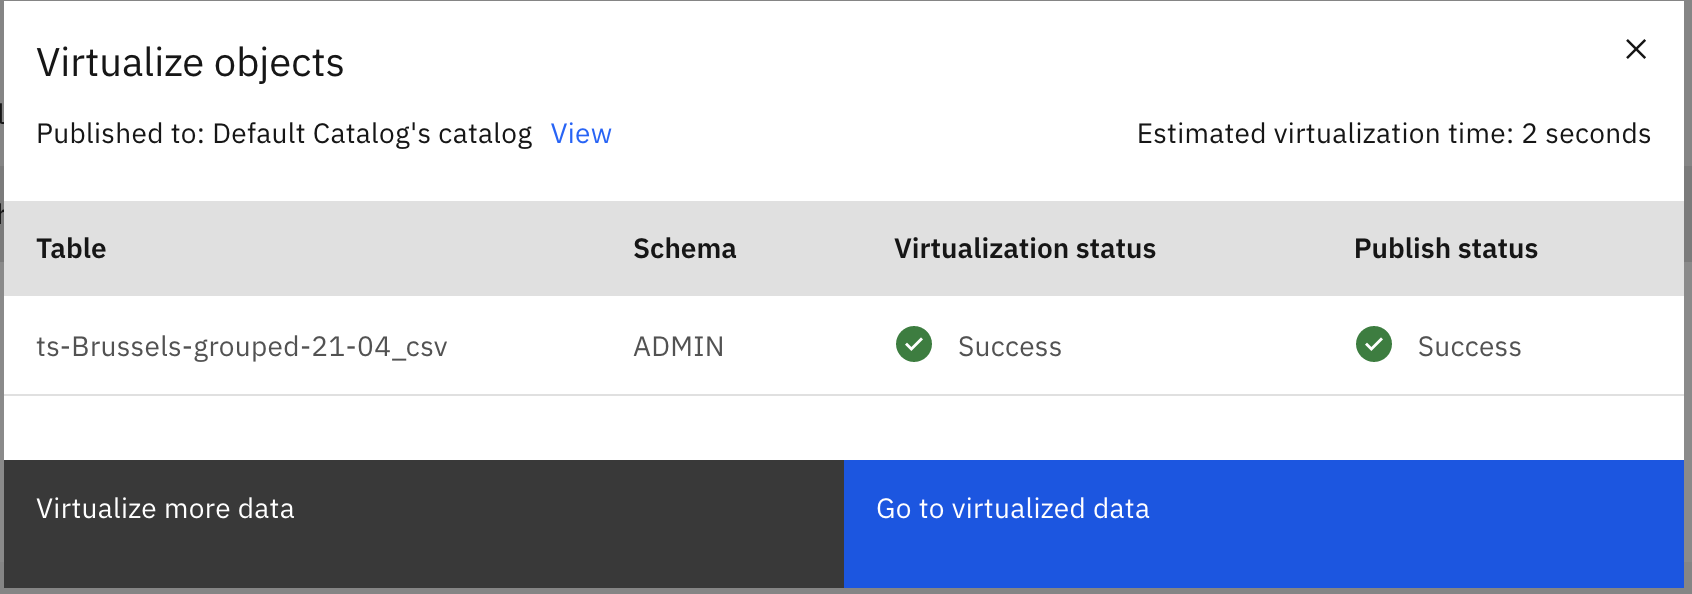
Click Continue to create Virtual tables.
- Click Go to virtualized data
Step 4: Create VIEW by joining two virtual tables/objects
Till now we have created connections with external data sources and from external data sources we picked tables and files to Virtualize them. Now we will use those Virtualize tables/objects and join them to create a VIEW. This VIEW will give us capability to query multiple data sources without creating data replicas.
You can follow below steps to create VIEW:
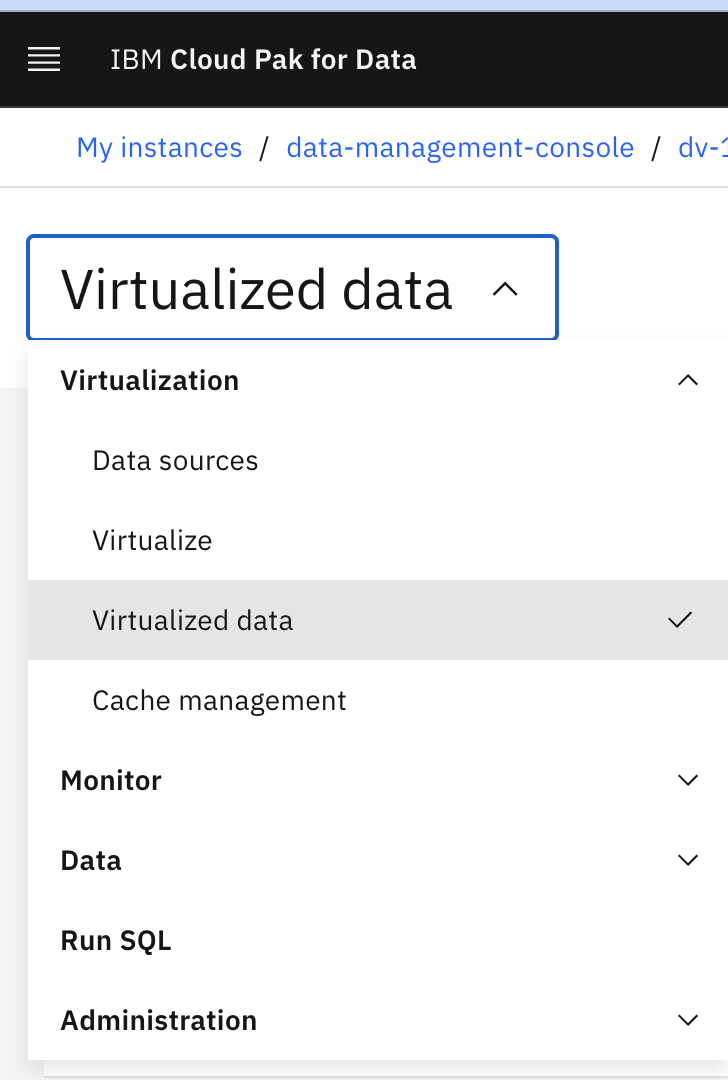
- Click Data Virtualization menu and expand Virtualization and then click Virtualized Data option.
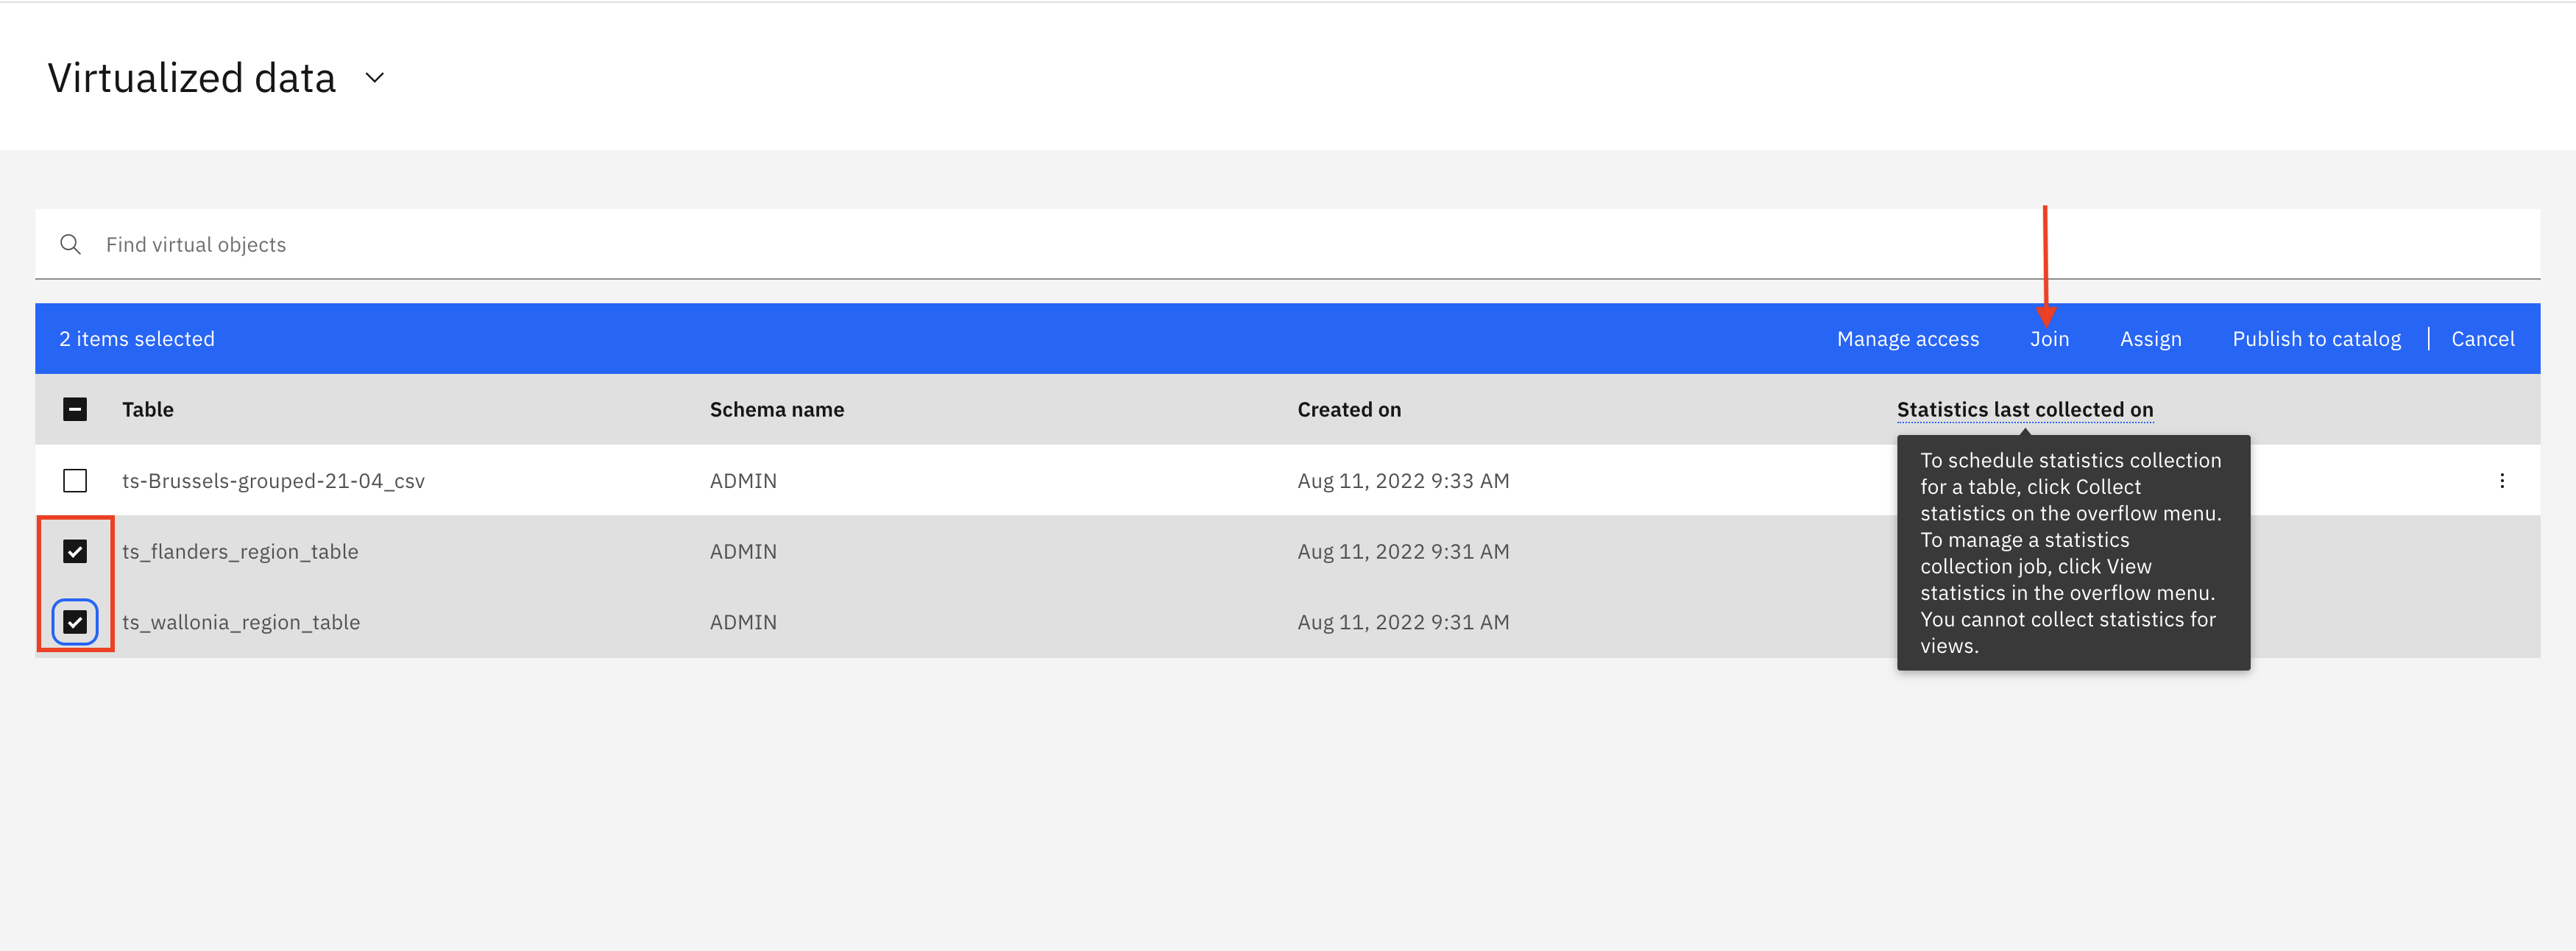
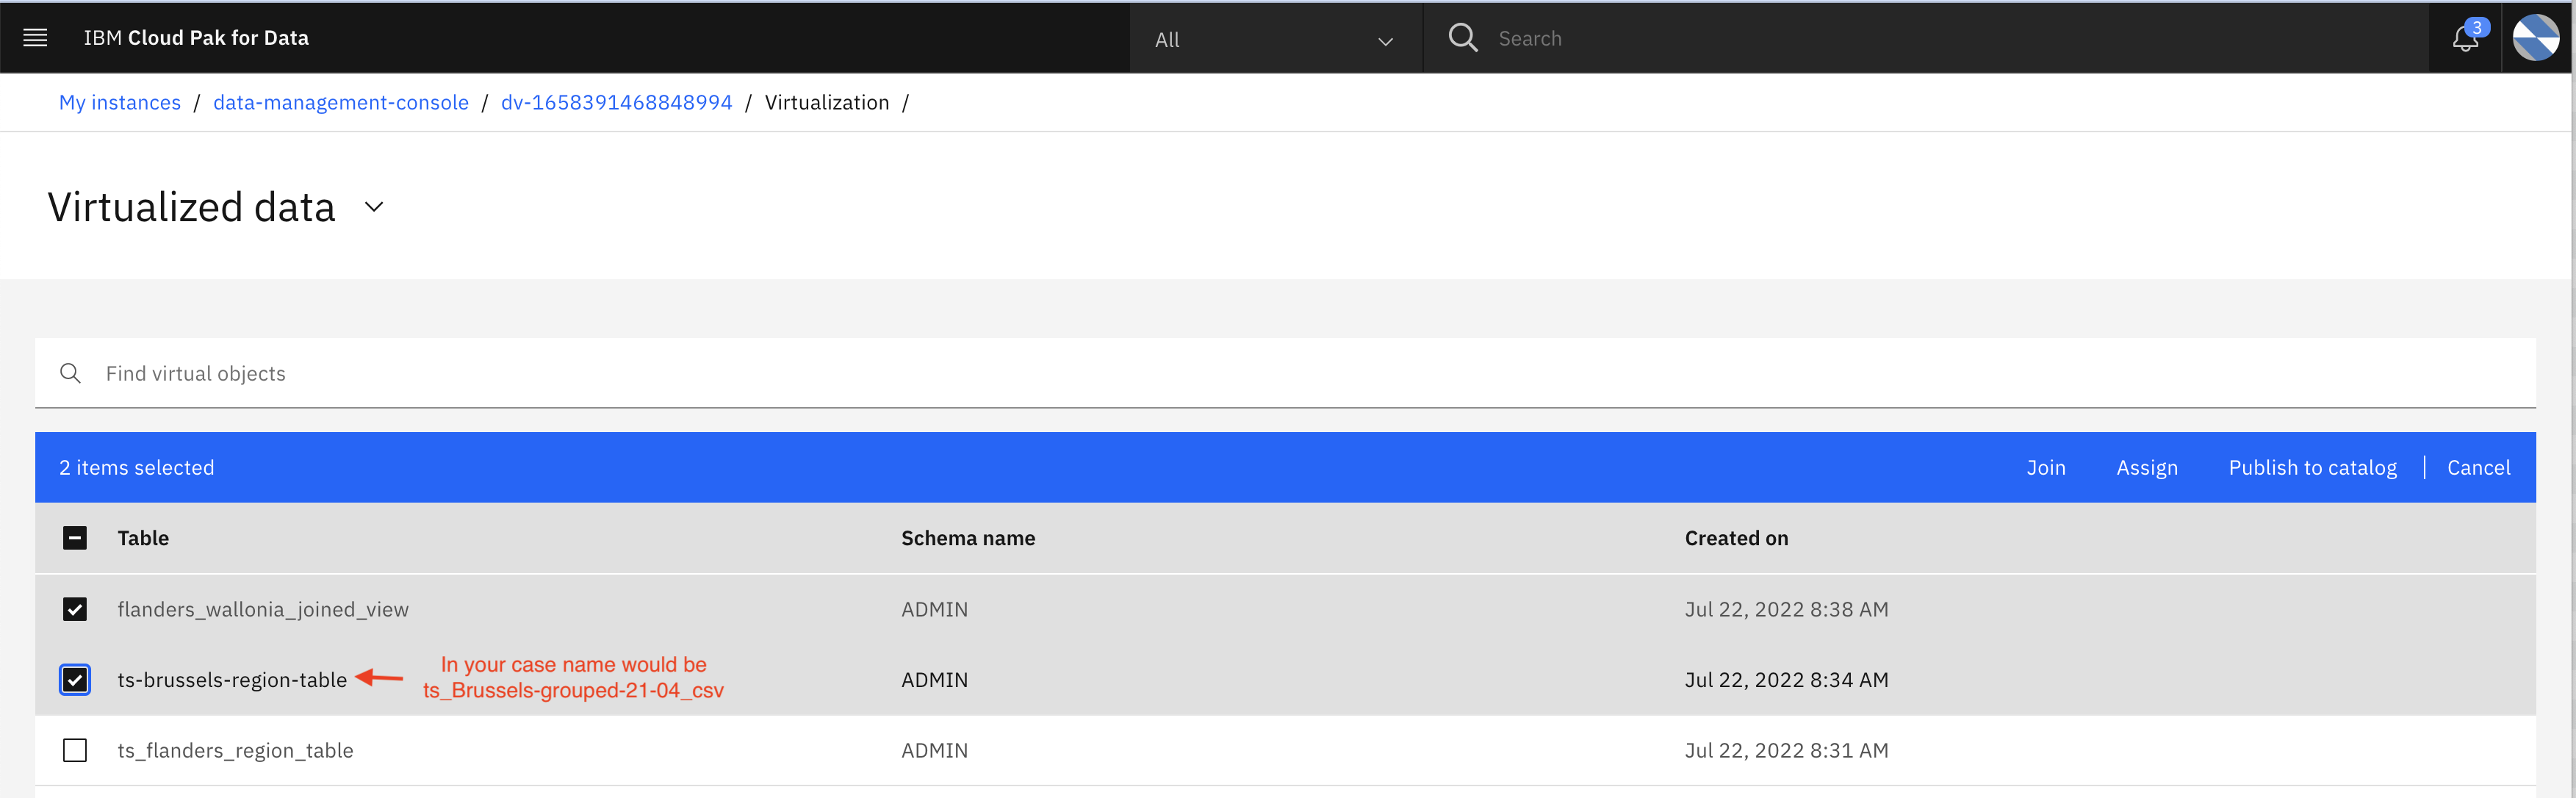
- Select the virtual tables which you have created in the previous step. (eg here ts_wallonia_region_table and ts_flanders_region_table) and click Join.
You may see multiple tables, choose only those two that you have created.
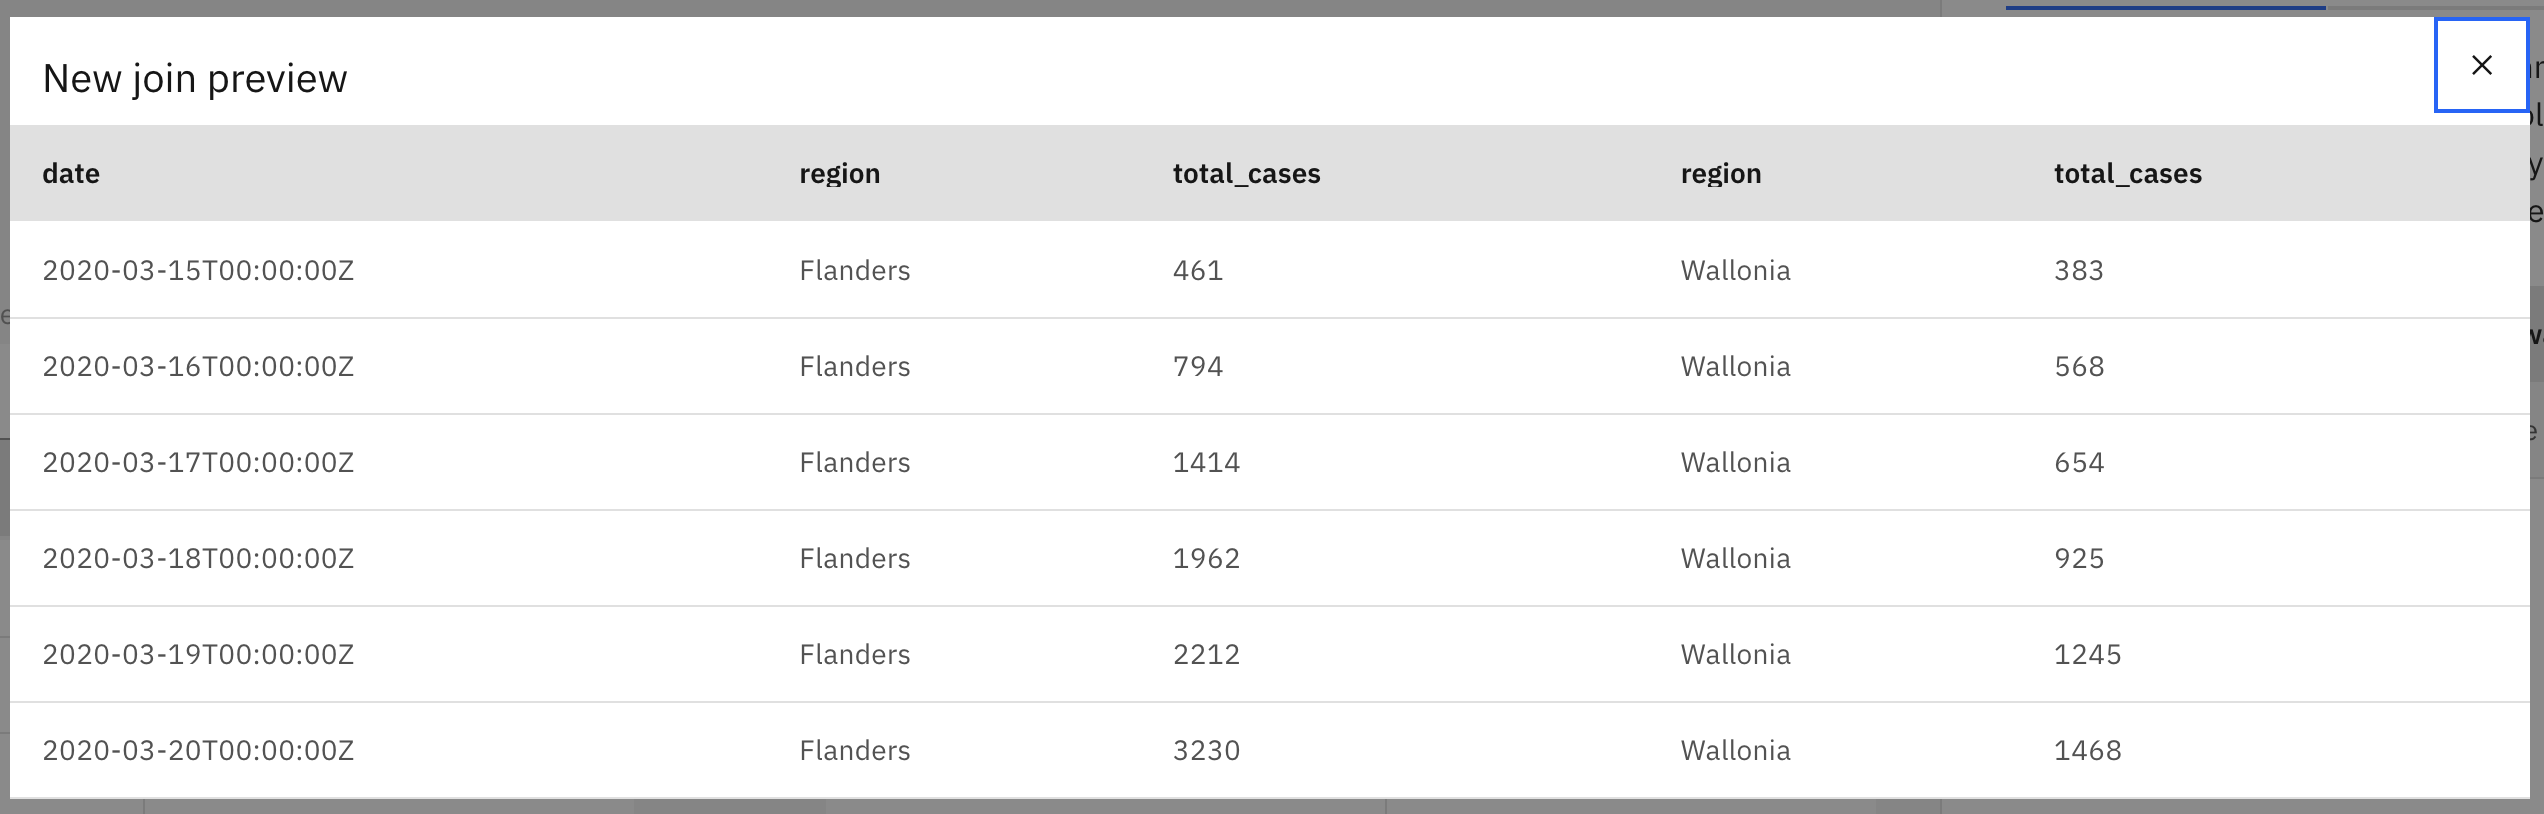
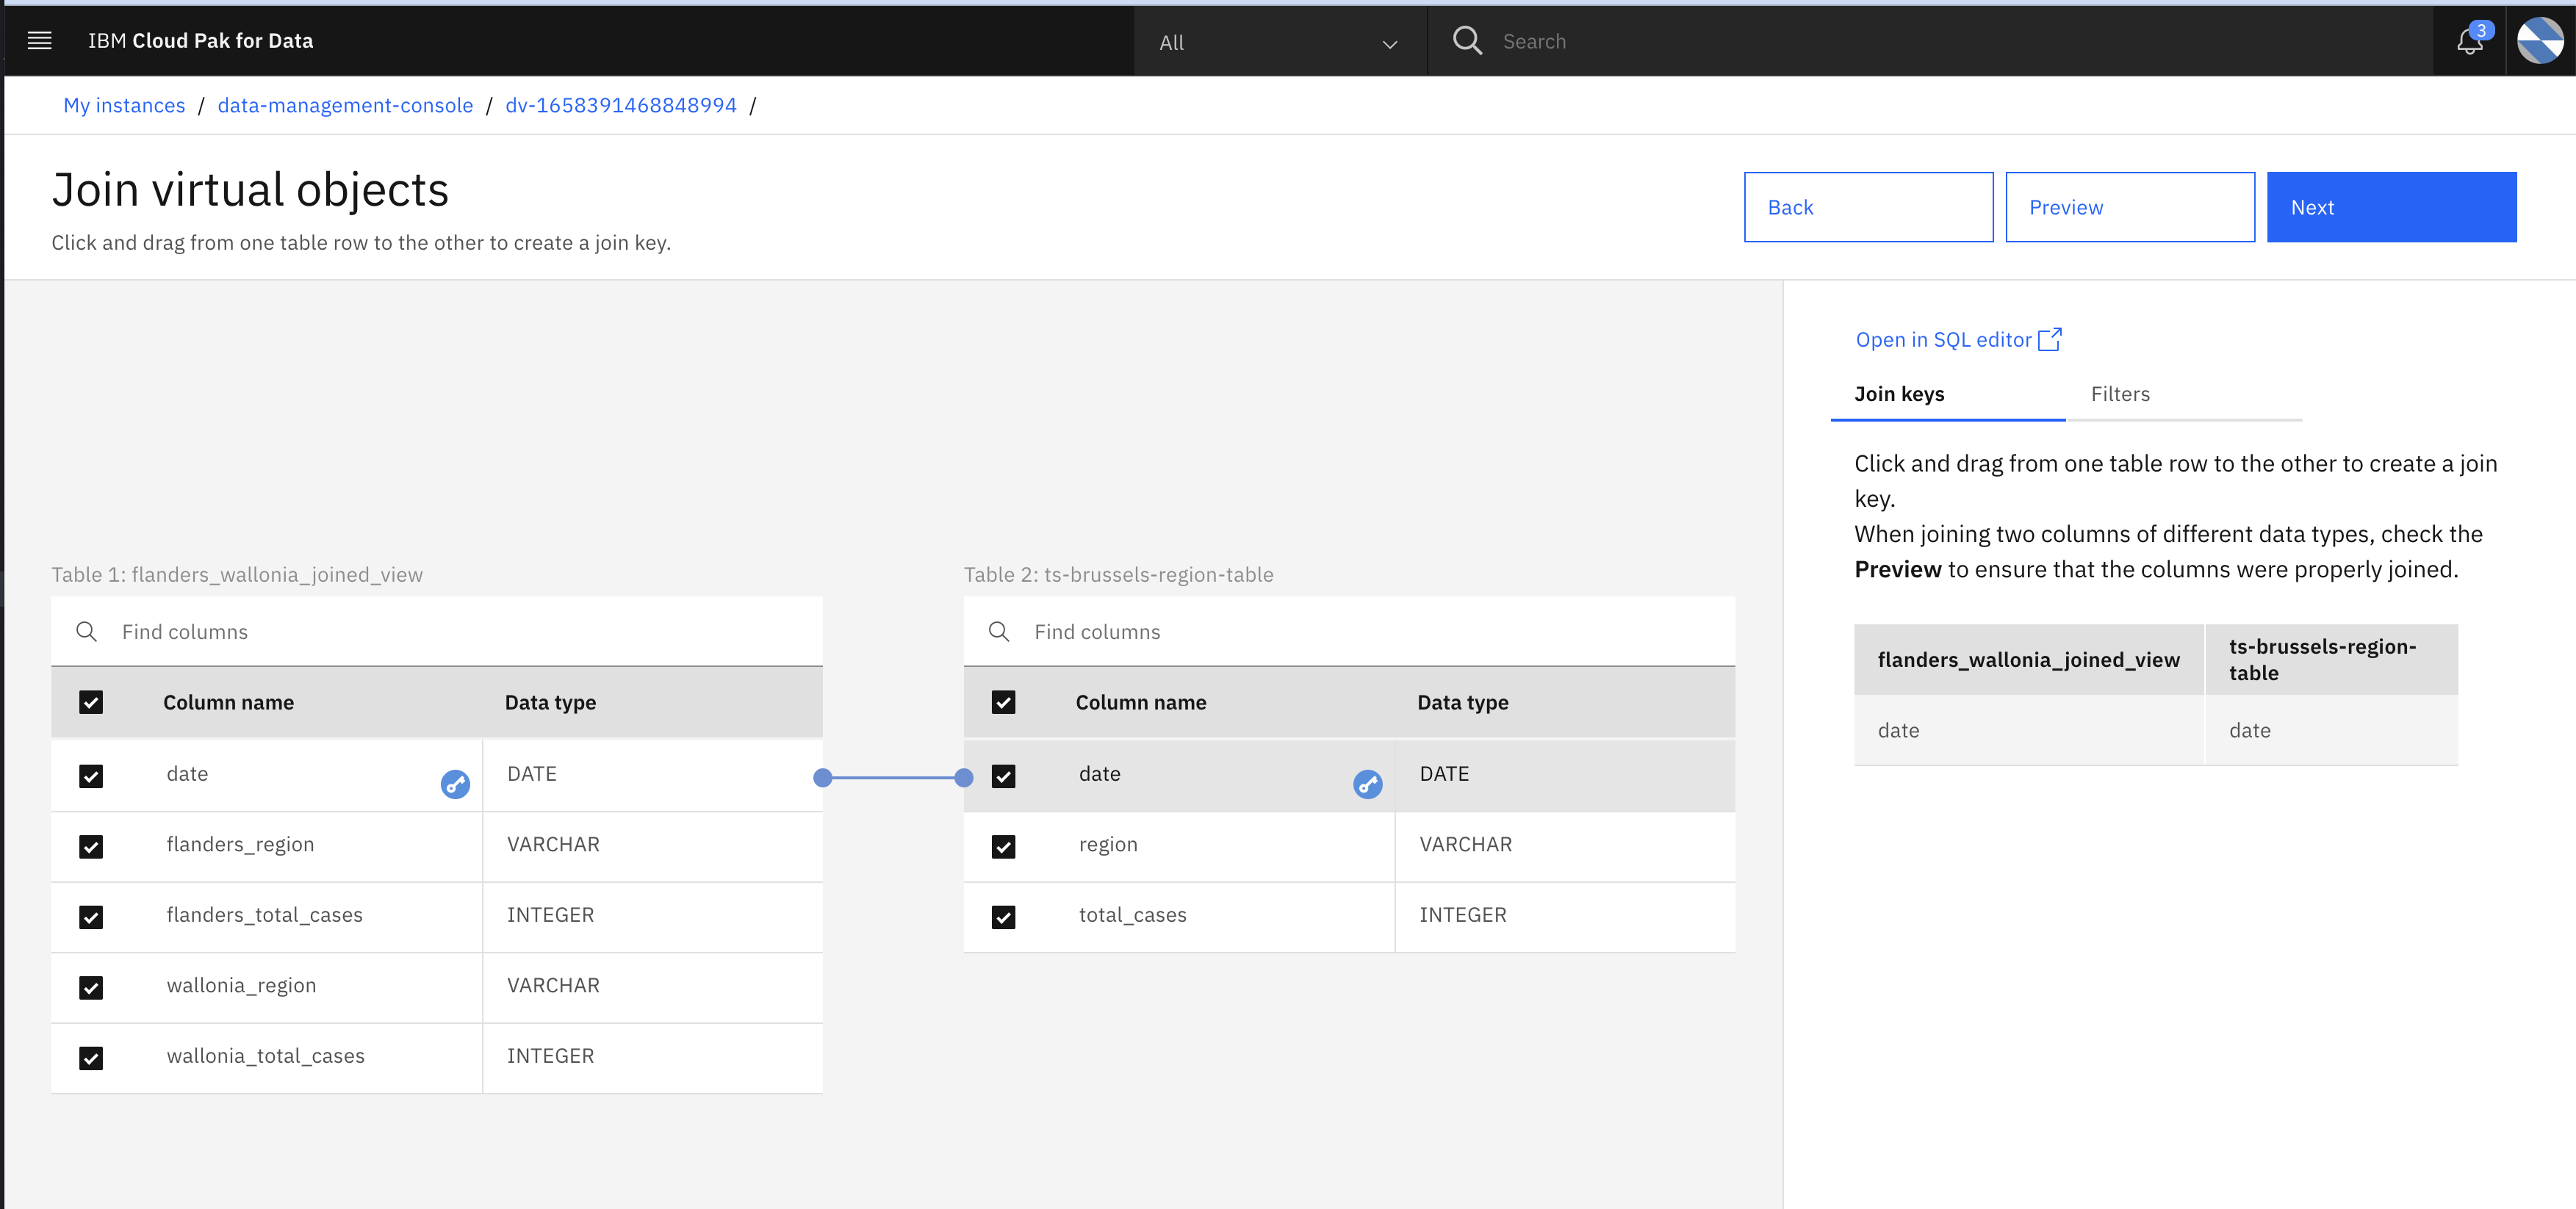
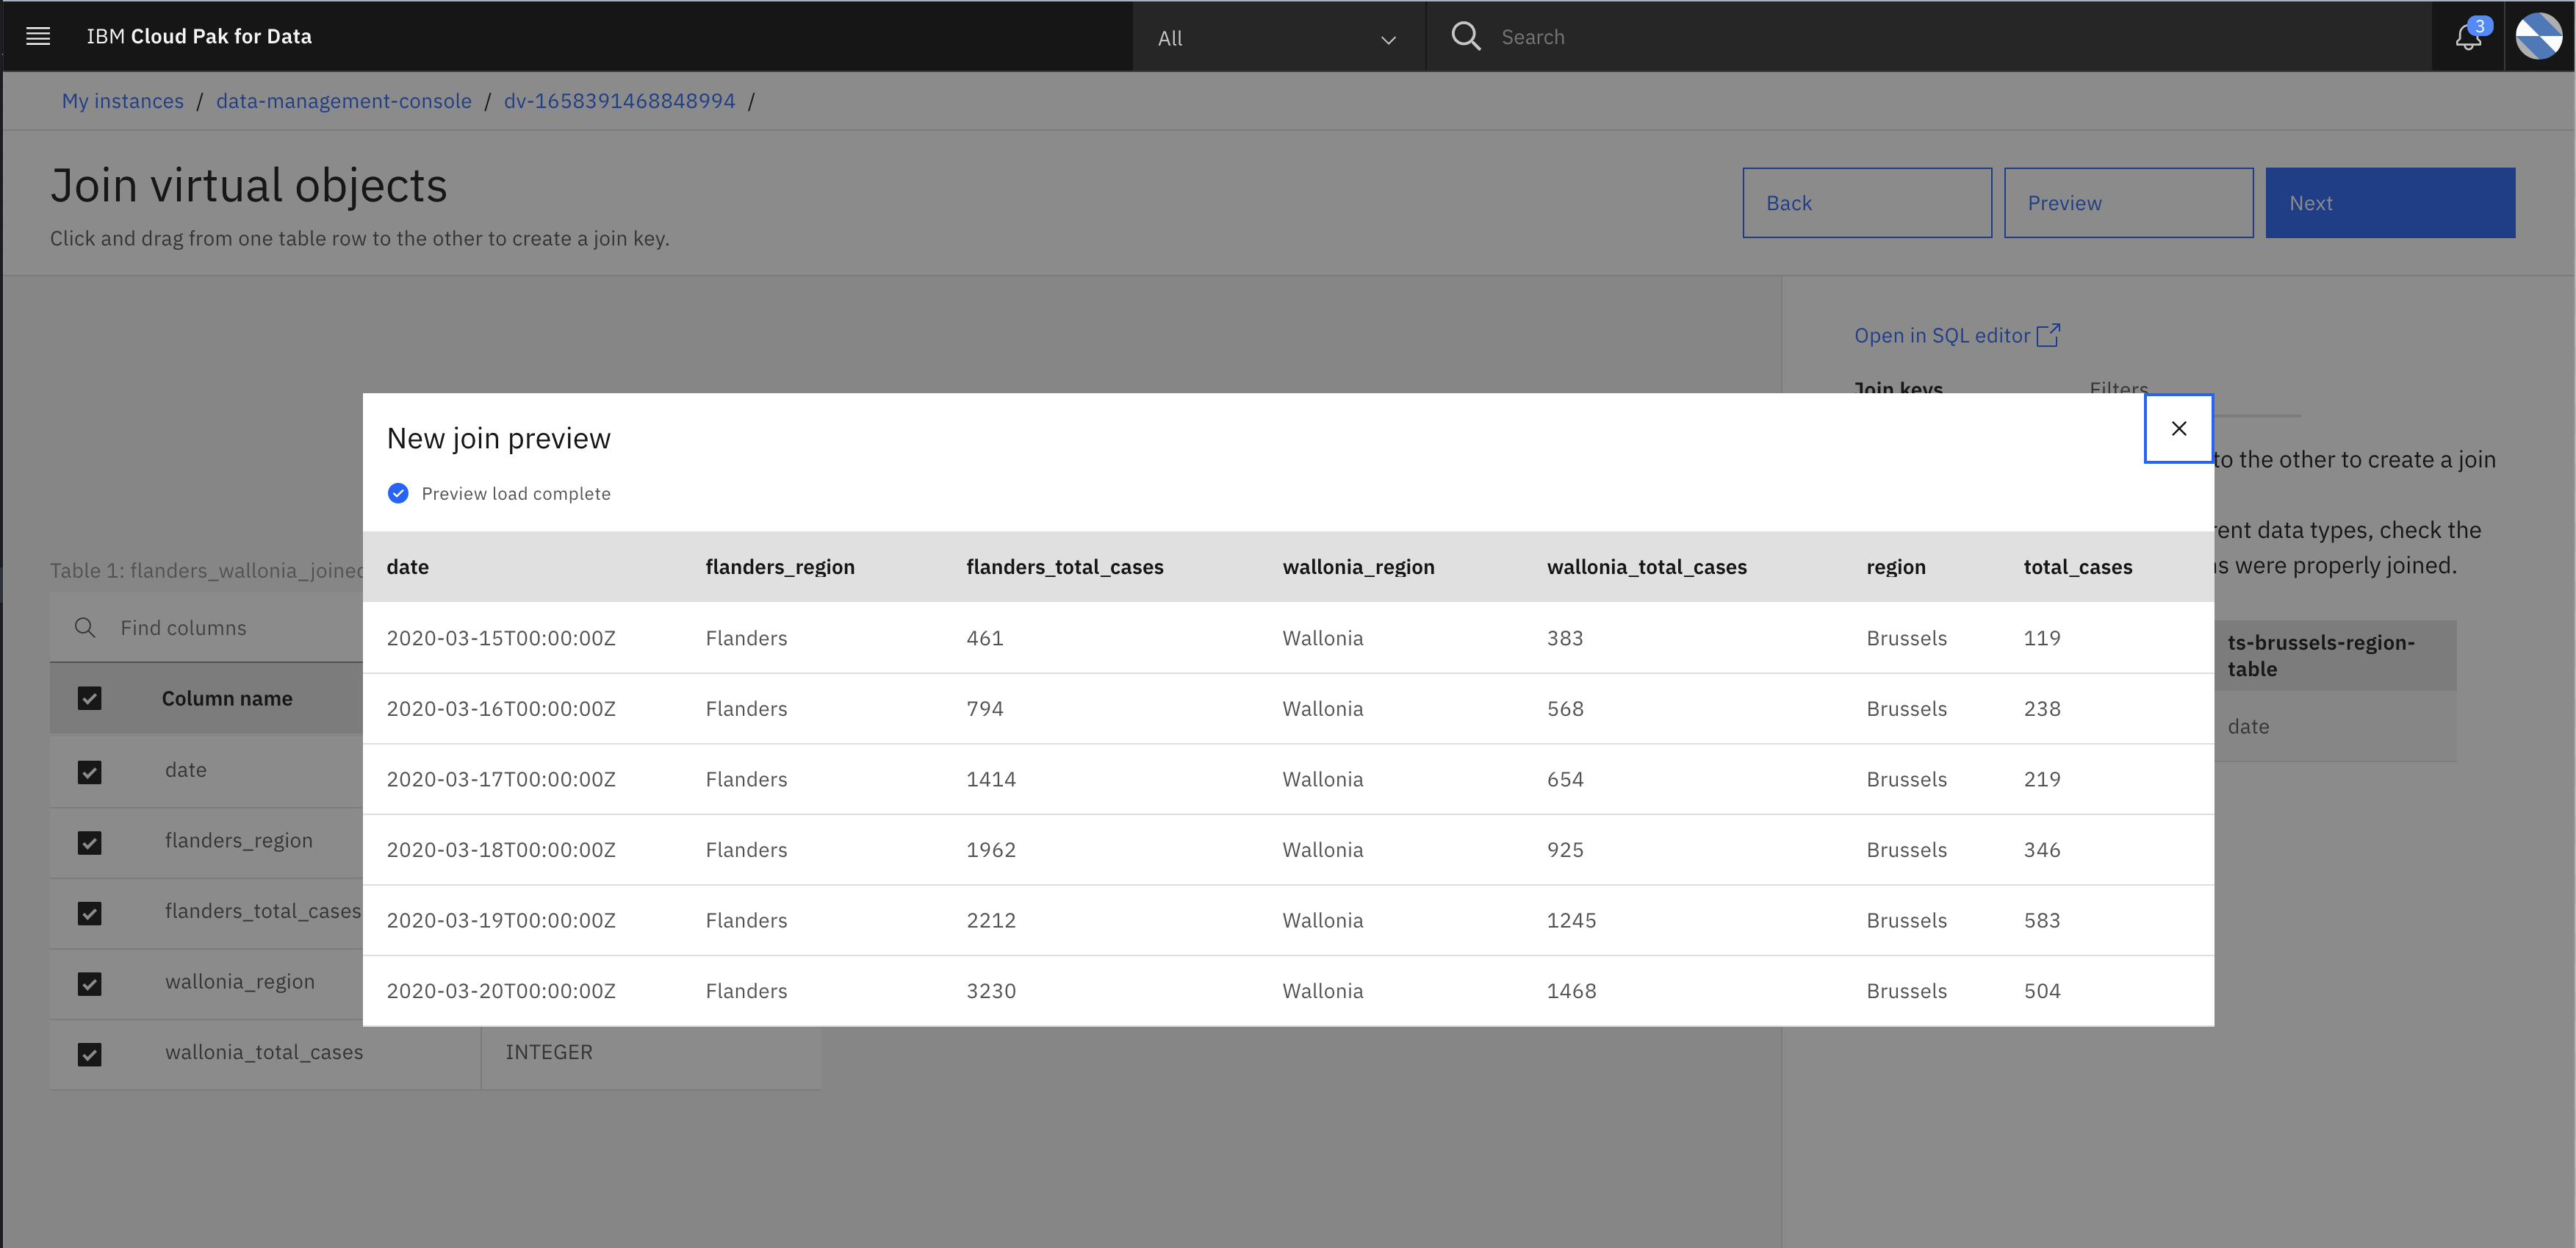
- Join two tables by specify join key and then click Preview to preview joined table.
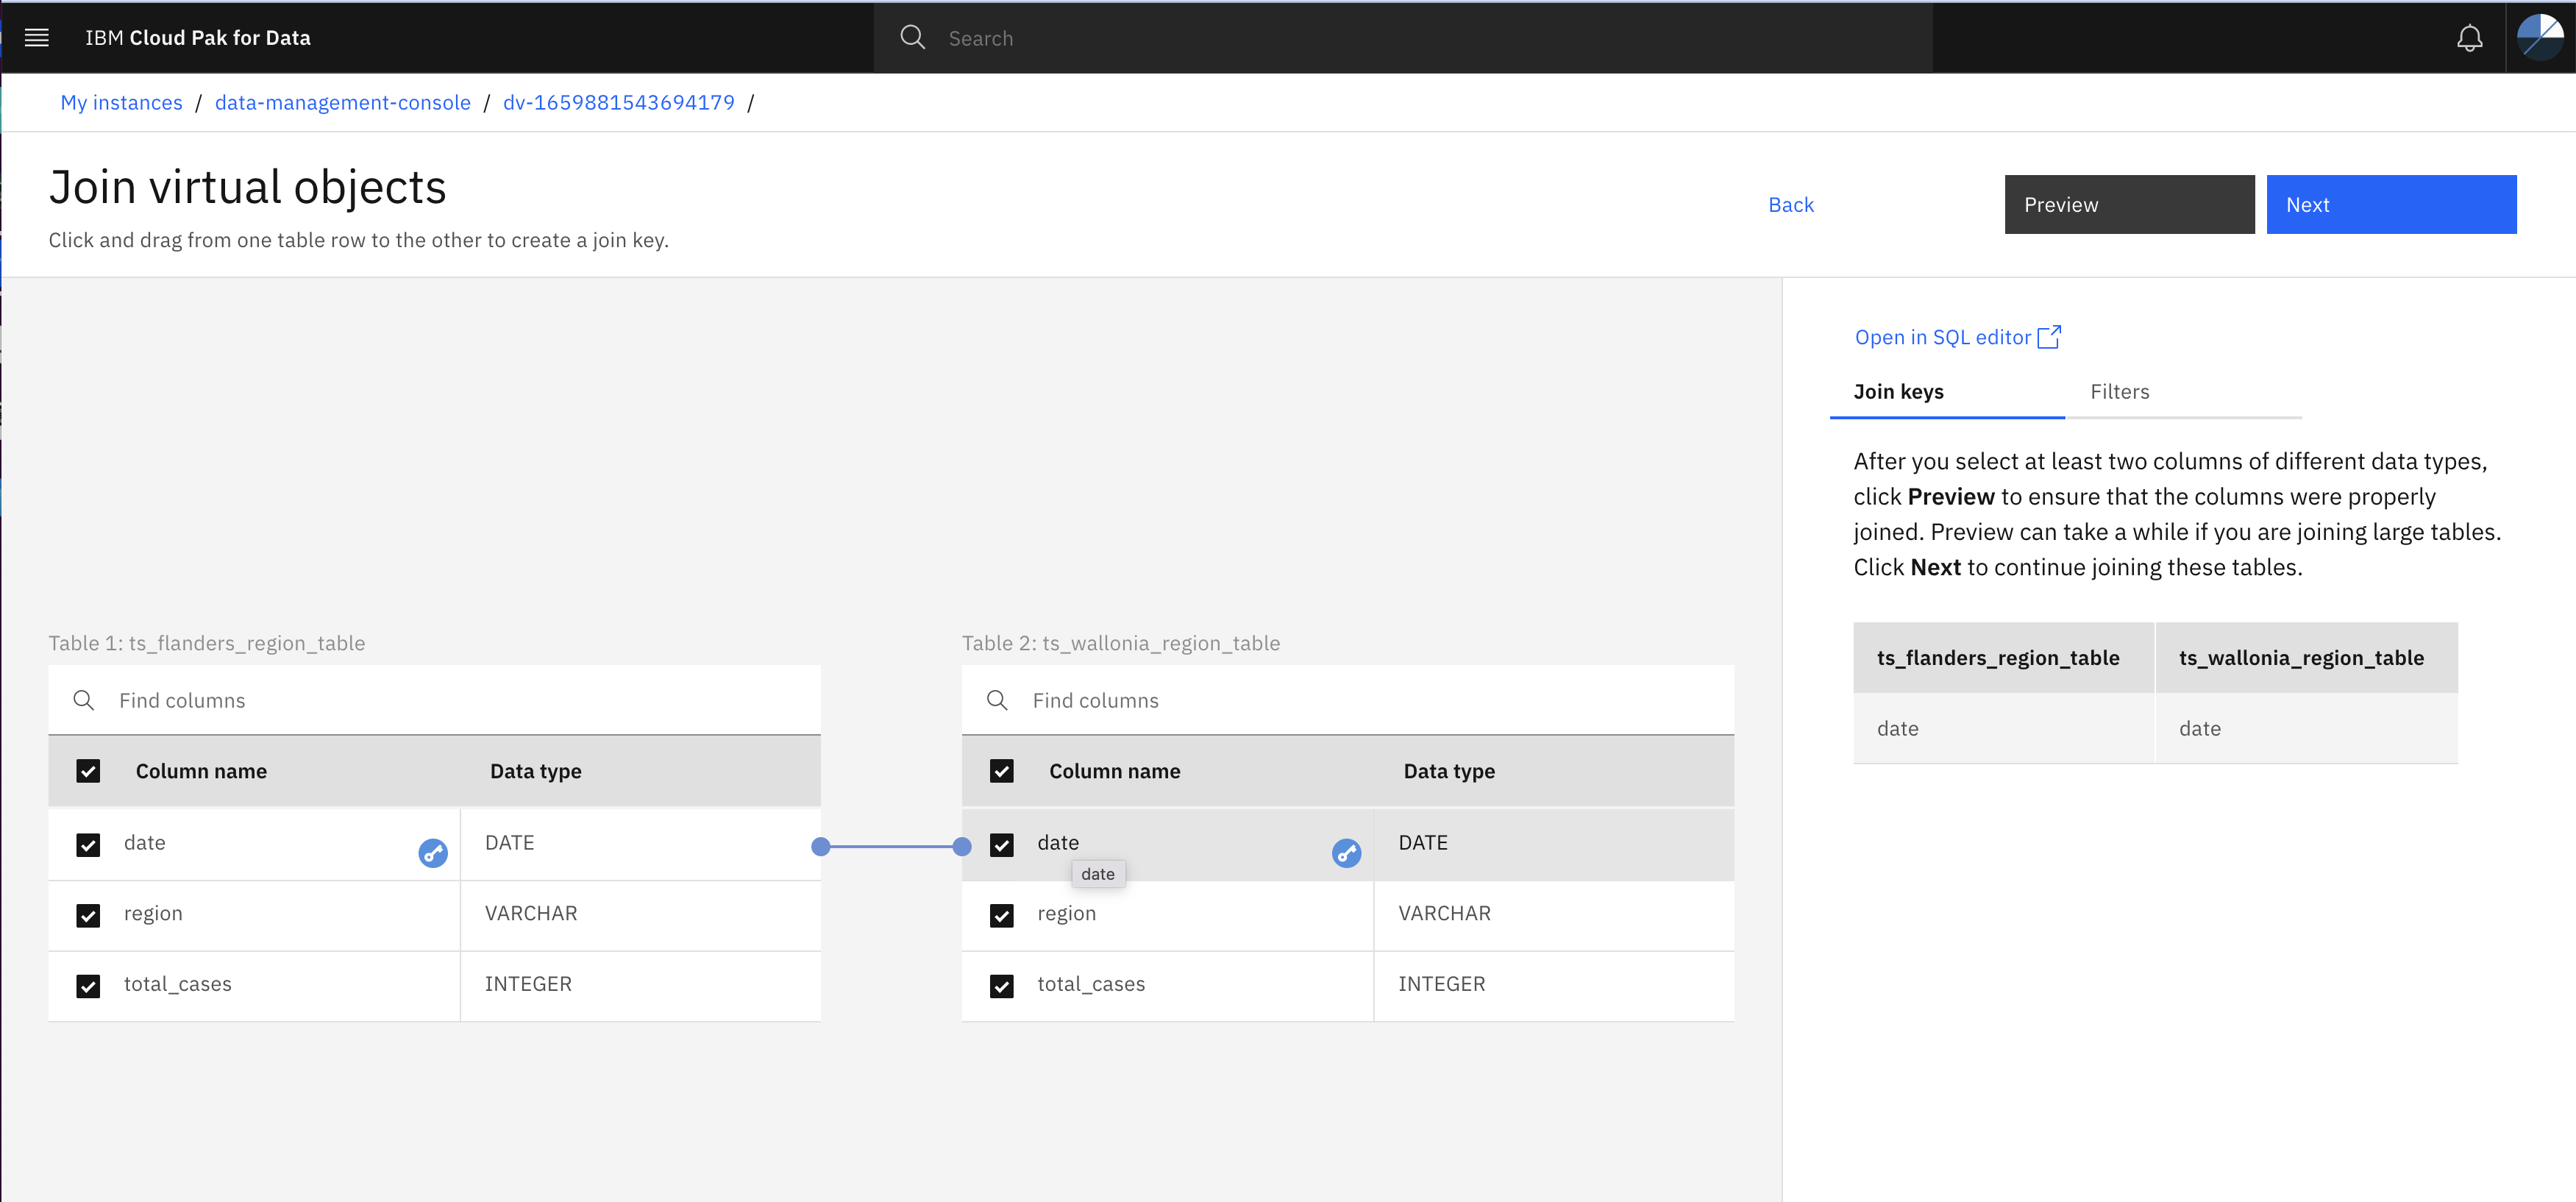
- Close preview page, click Next on Join virtual objects page
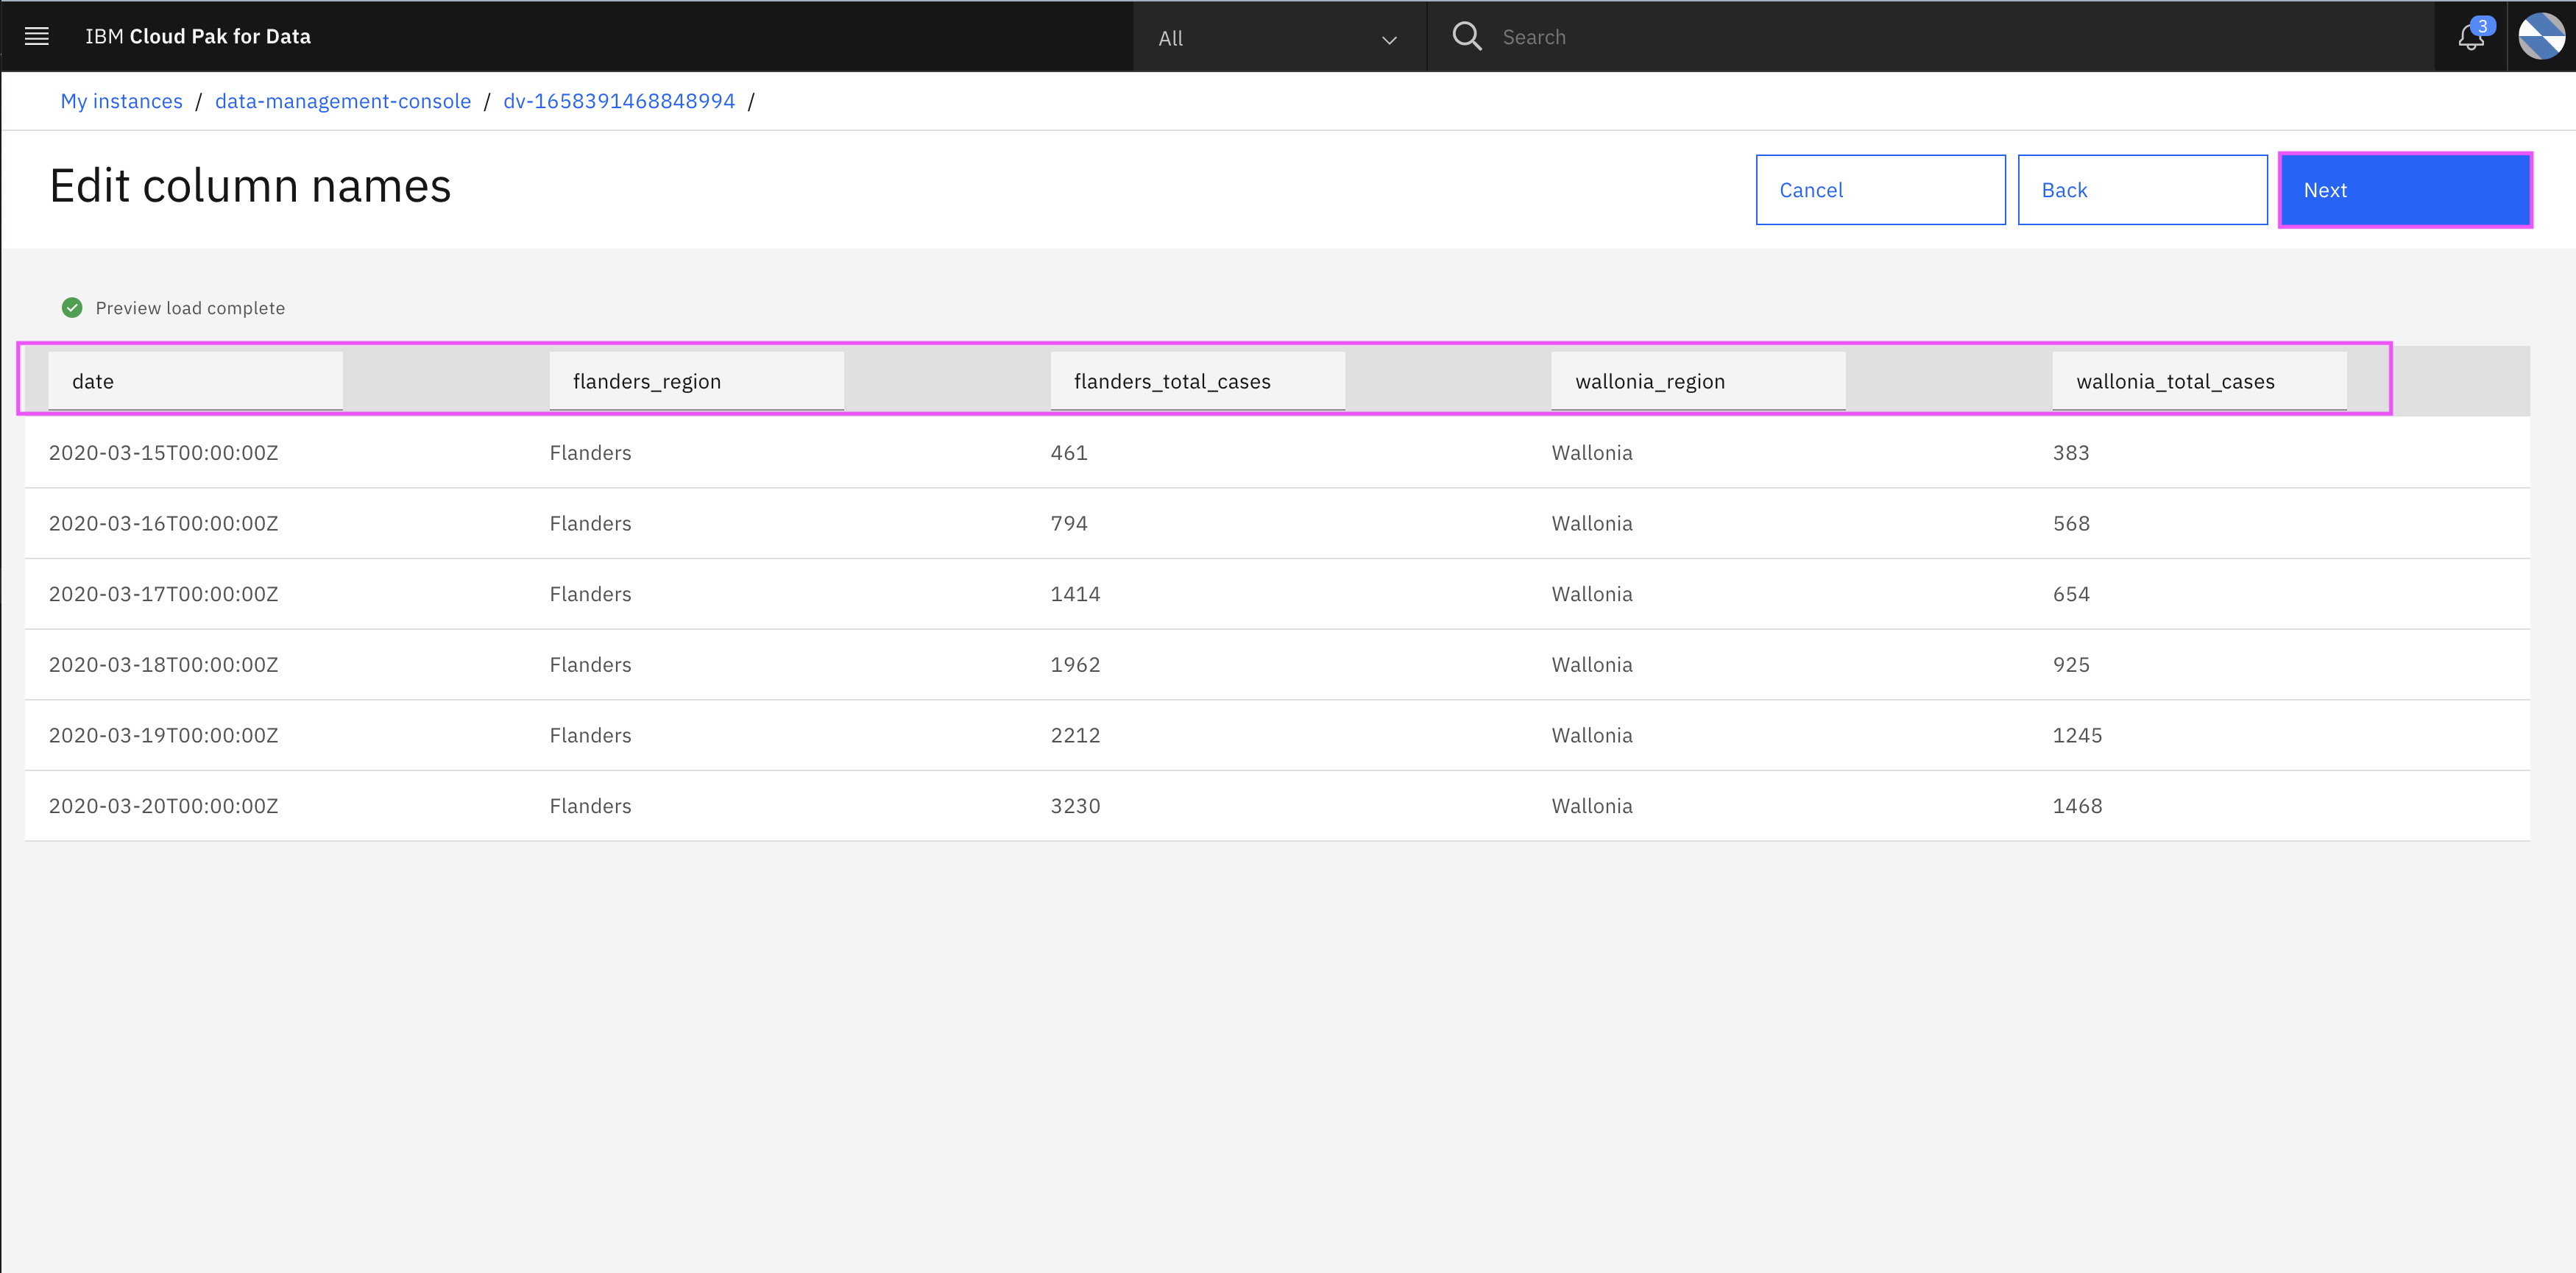
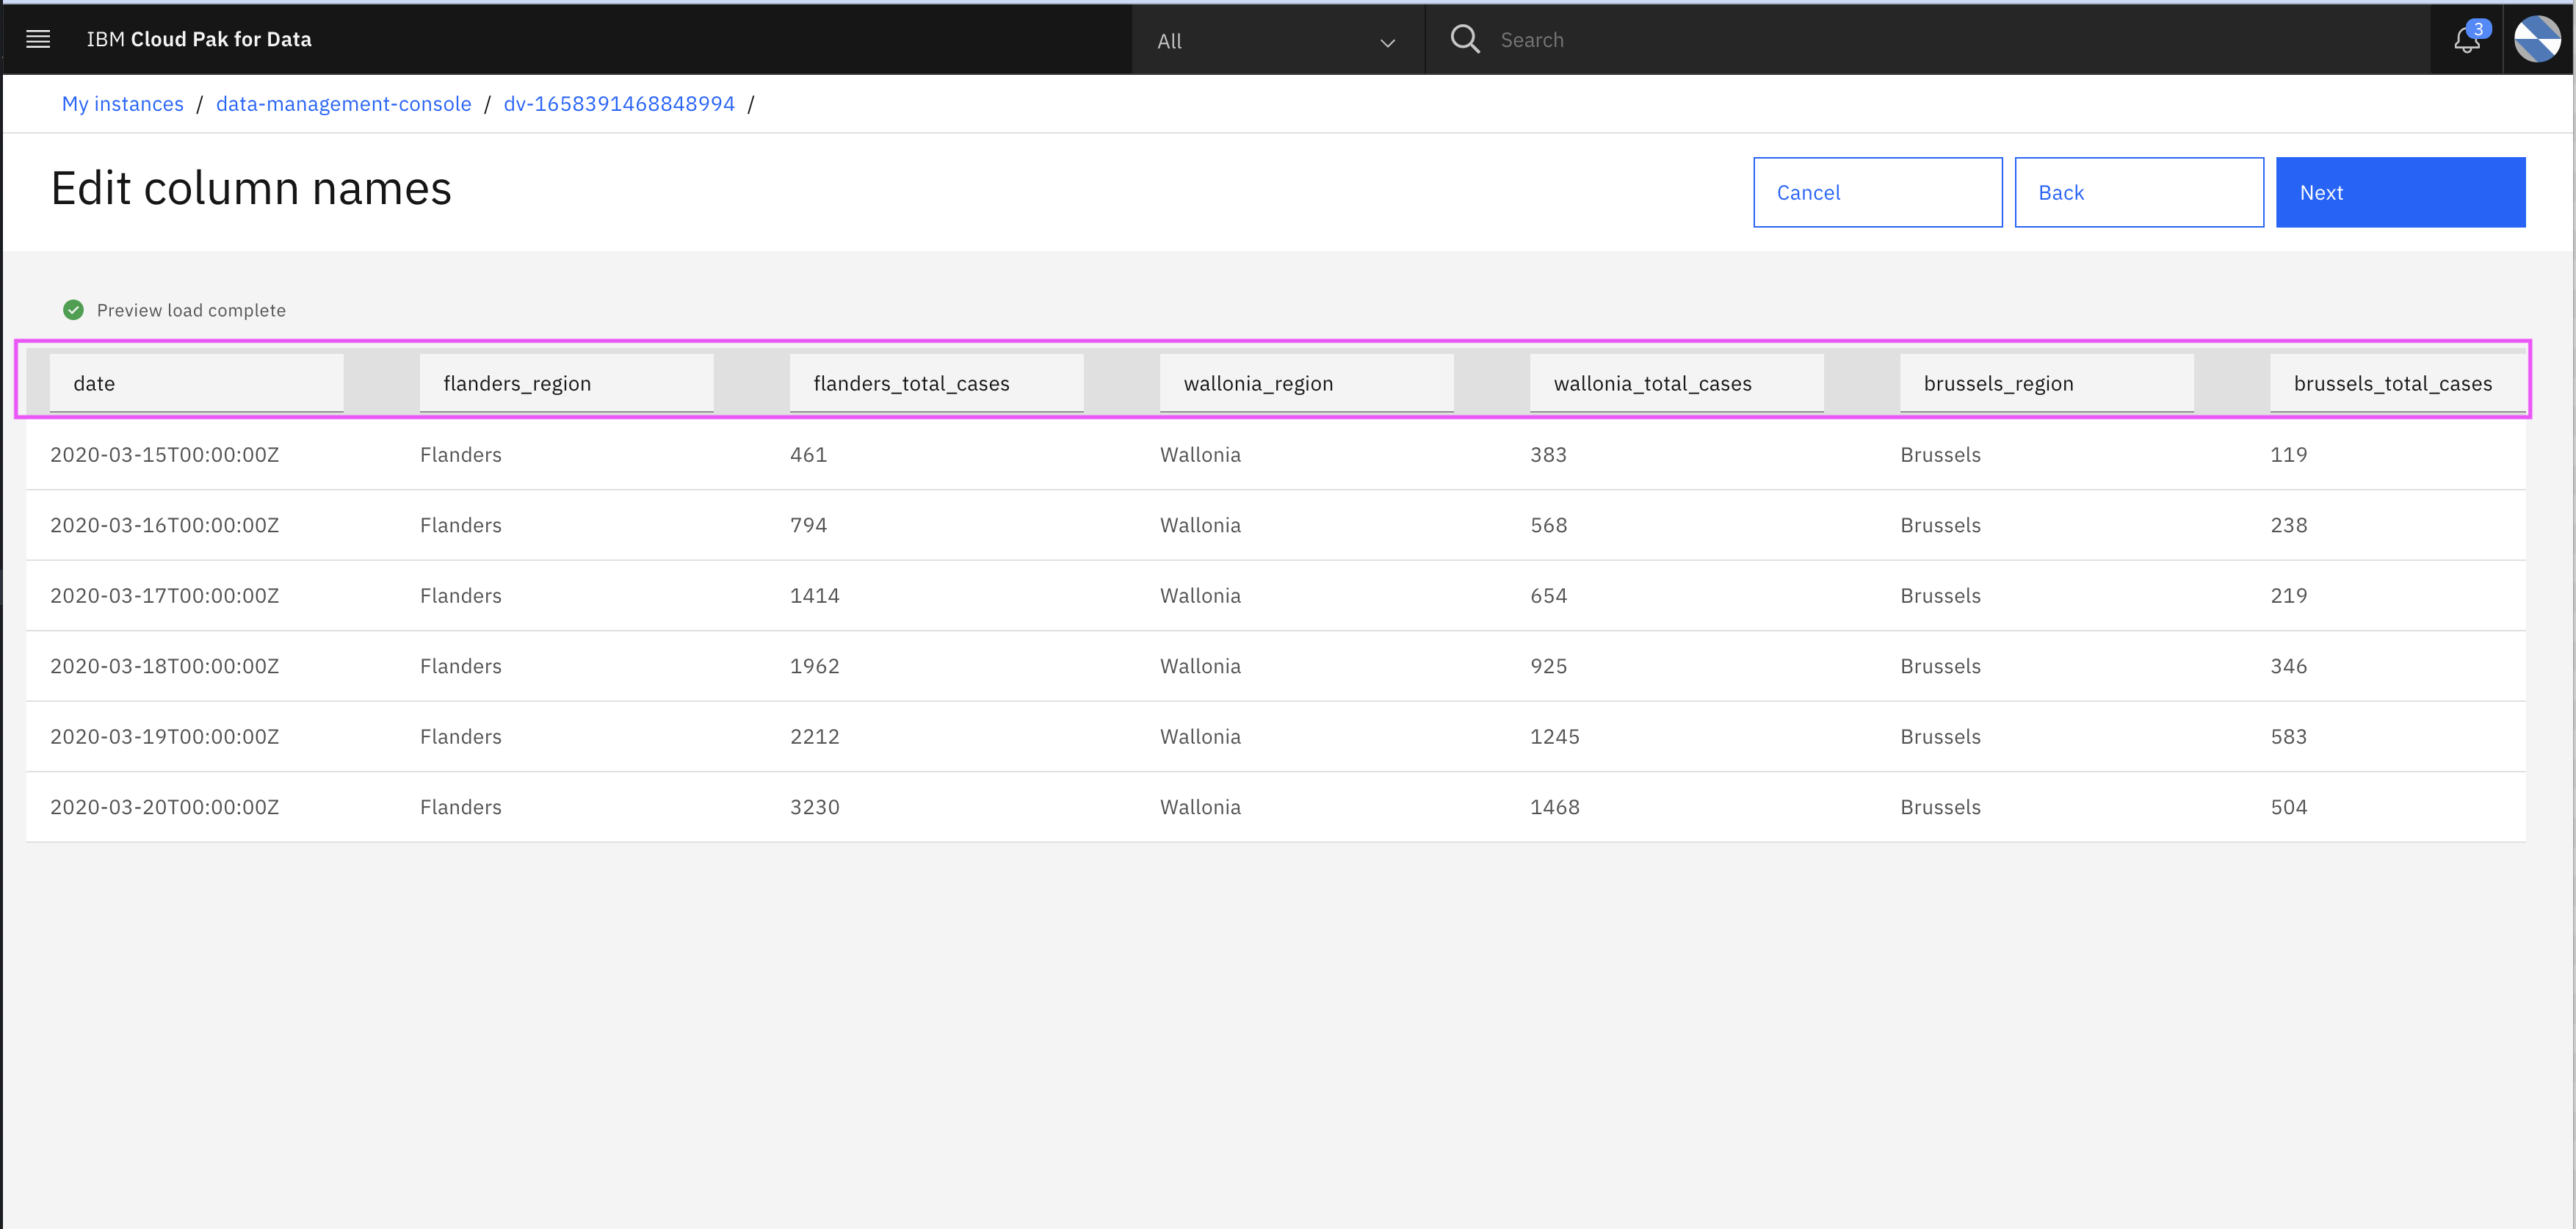
- Edit the column names as shown in below image. Make sure you have all column names in smallcase
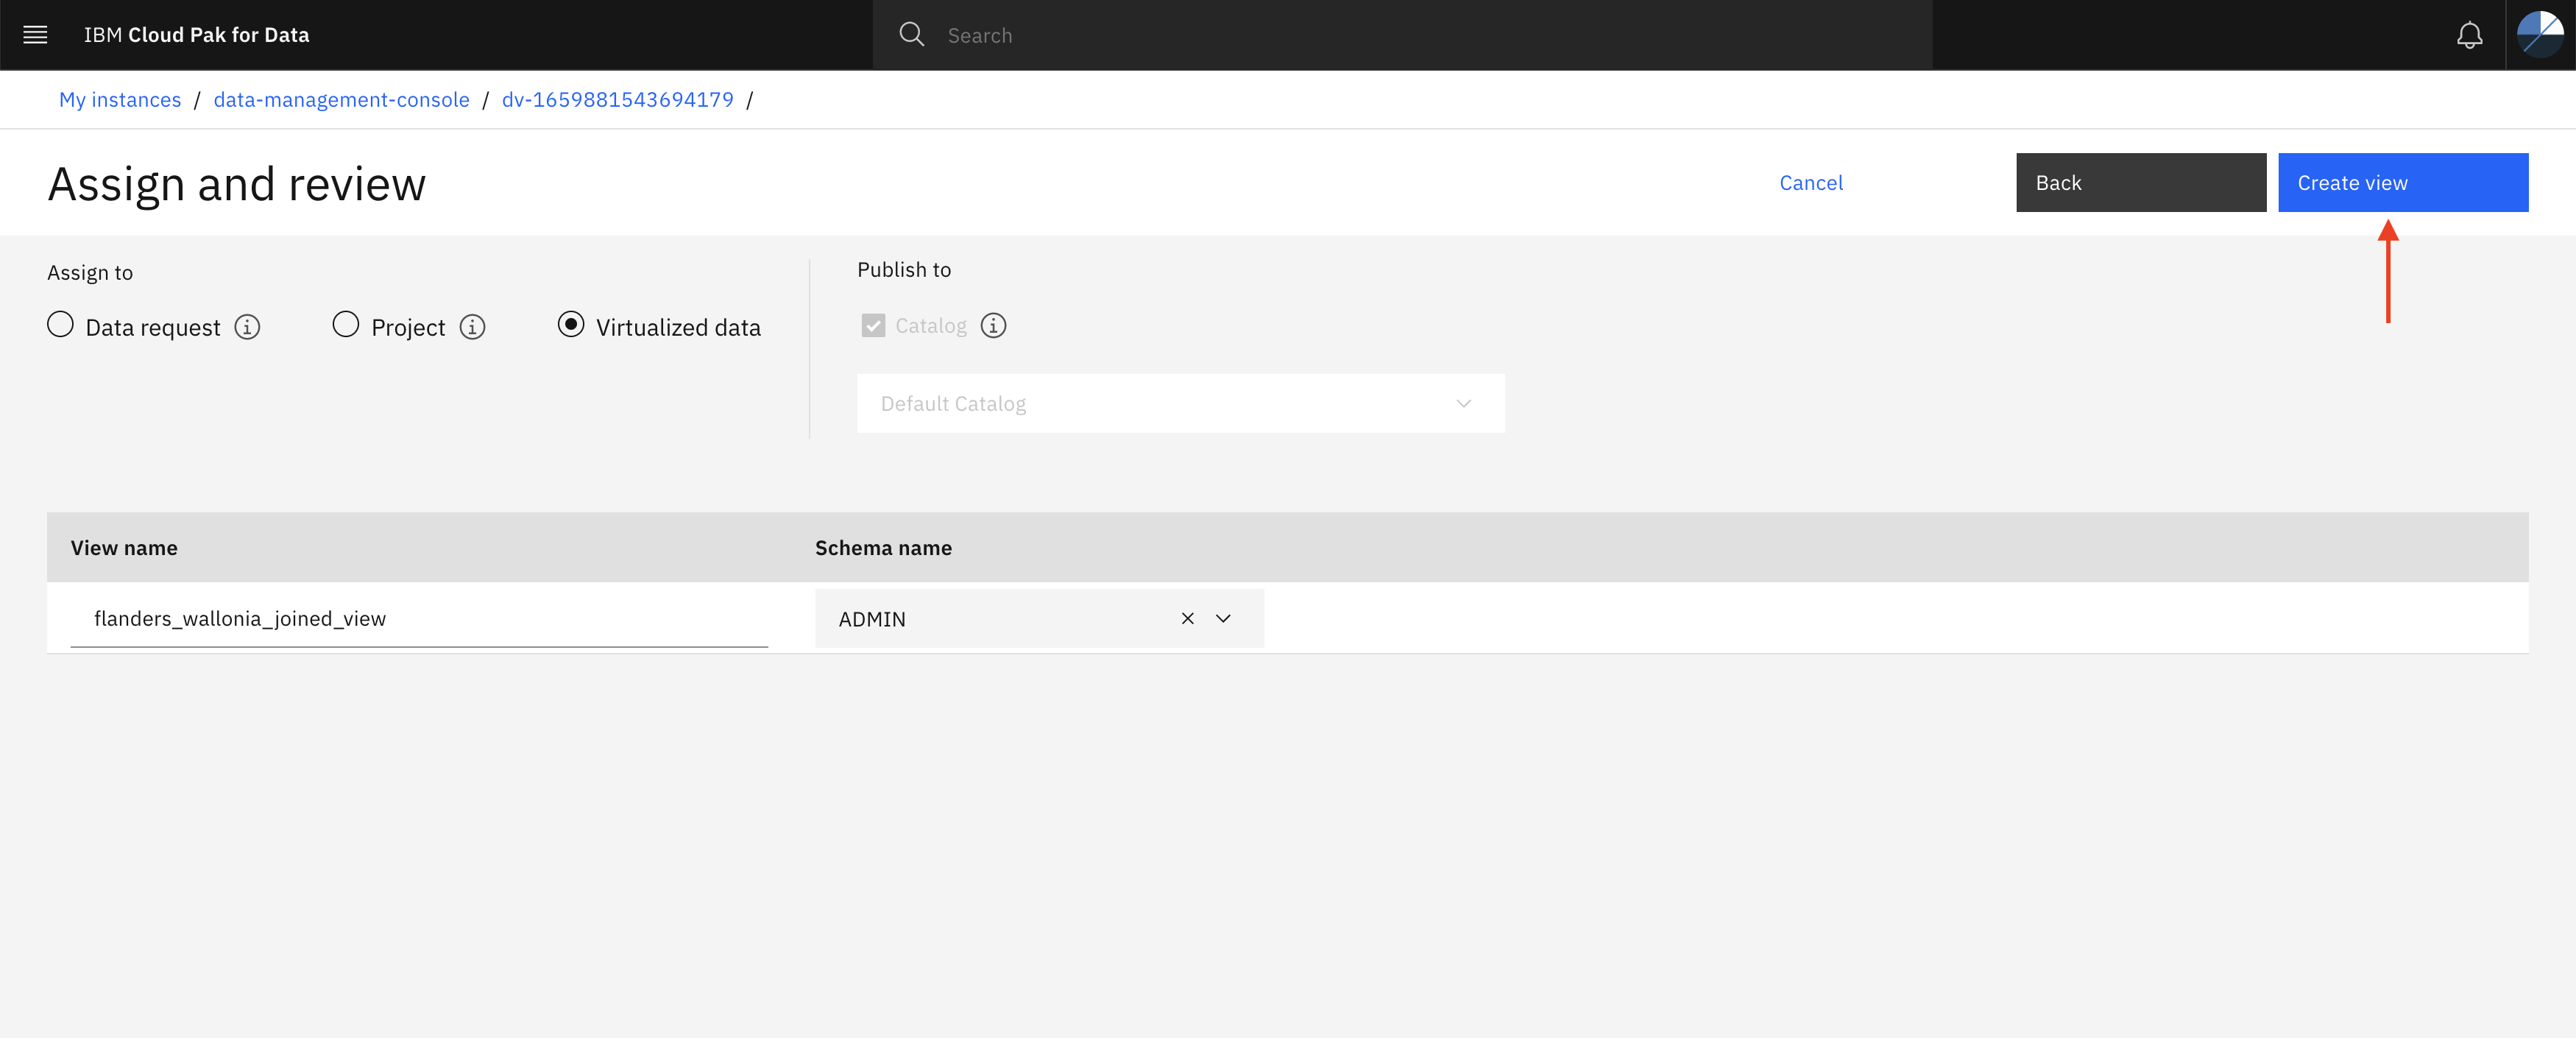
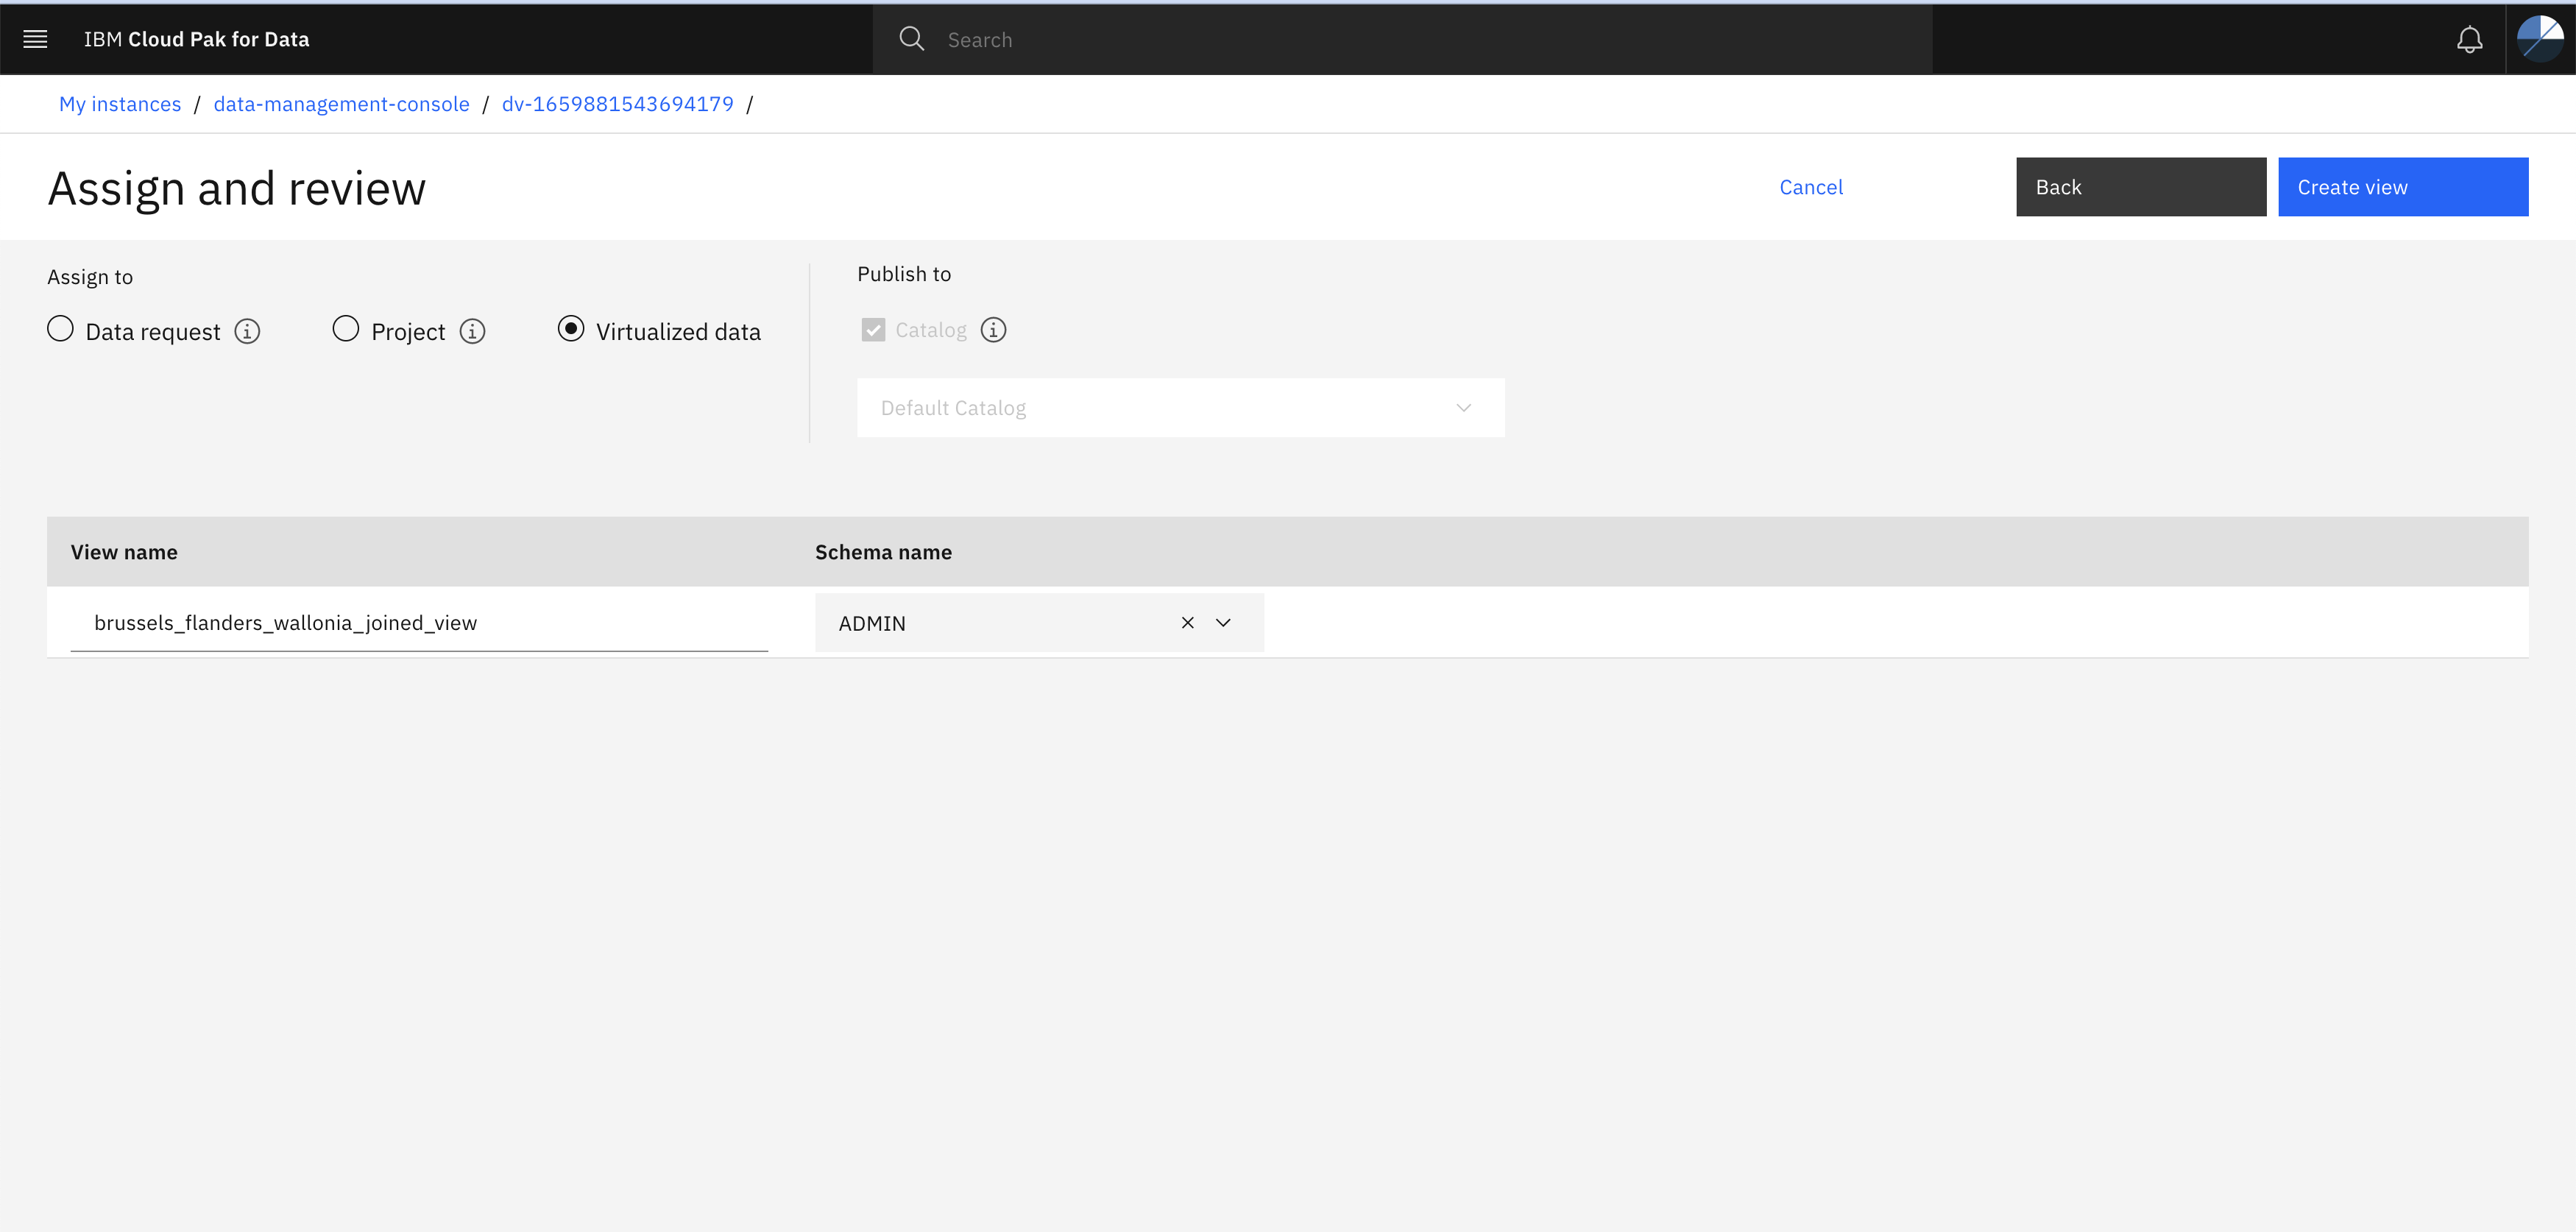
- Once after ensuring all details, provide unique view name (eg. flanders_wallonia_joined_view), select Virtualized data checkbox and click Create view.
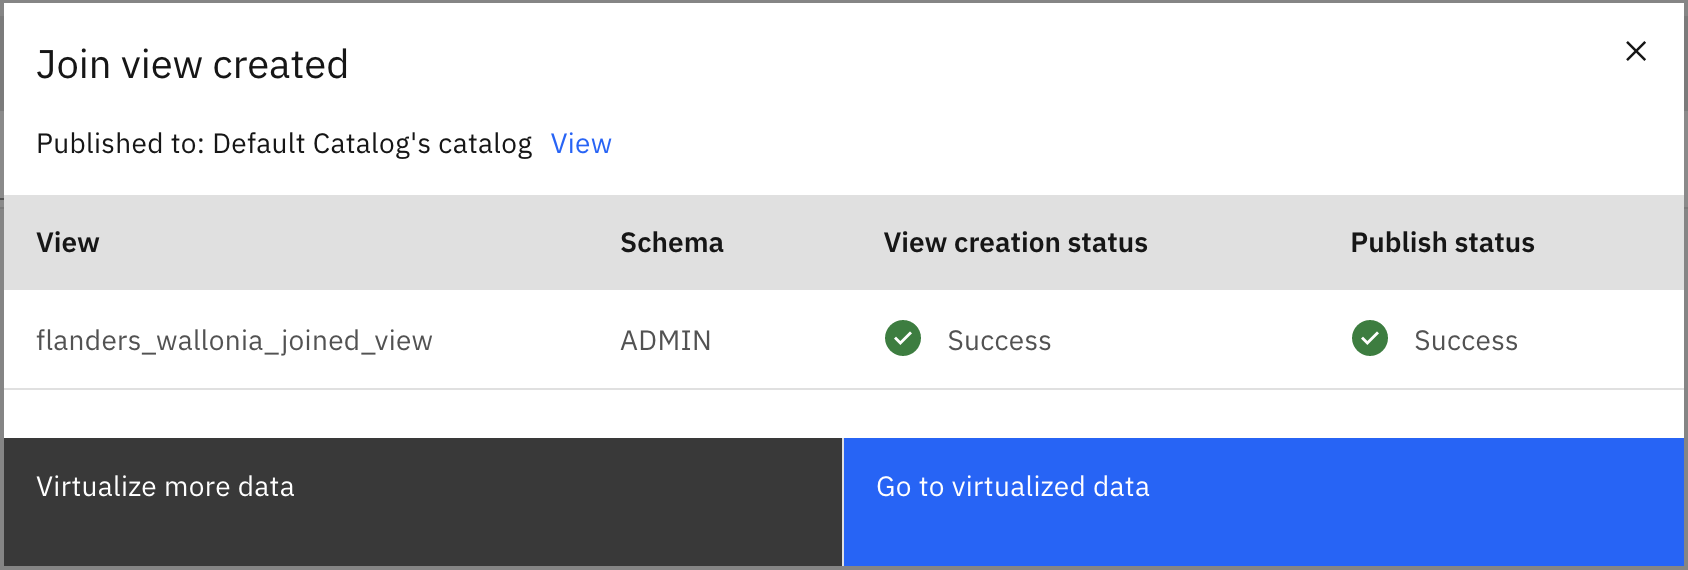
Click go to virtualized data
- Click ‘Virutalized Data’ and Select joined view you created in previous step (eg. flanders_wallonia_joined_view) and ts_Brussels-grouped-21-04_csv table to create view.
- Specify date as join Key and click Preview
- Edit the column names as shown below
- Specify the view name (eg. brussels_wallonia_flanders_joined_view) and click Create view
By following all the steps you have created a single joined view from different data source. Now let’s go to the Catalog to view the data.
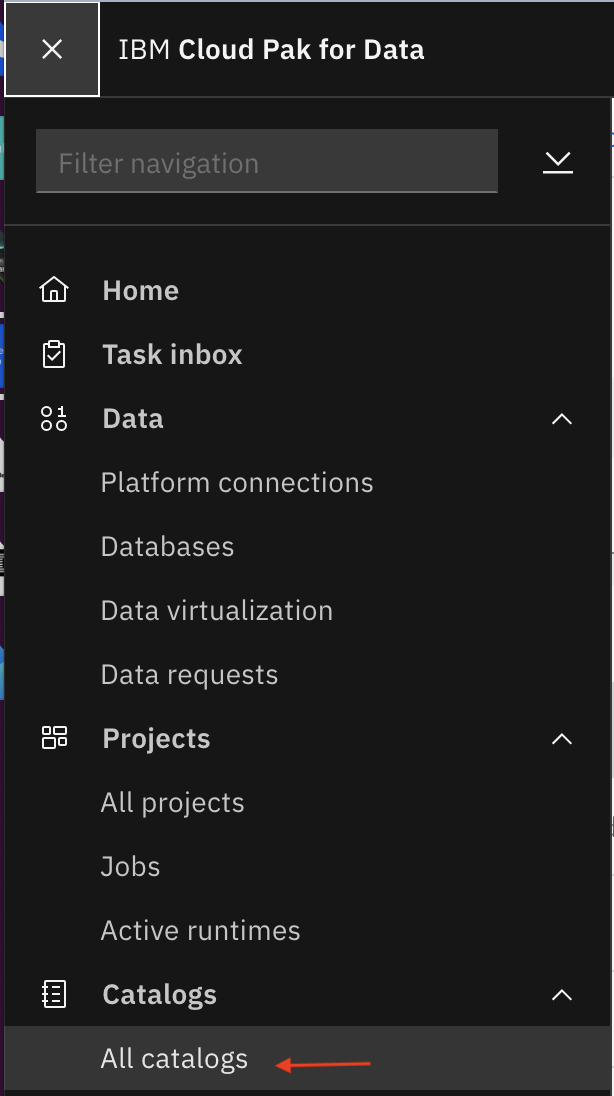
- Click navigation bar and expand Catalogs and click All Catalogs and select default catalog to see the view we created in last step.
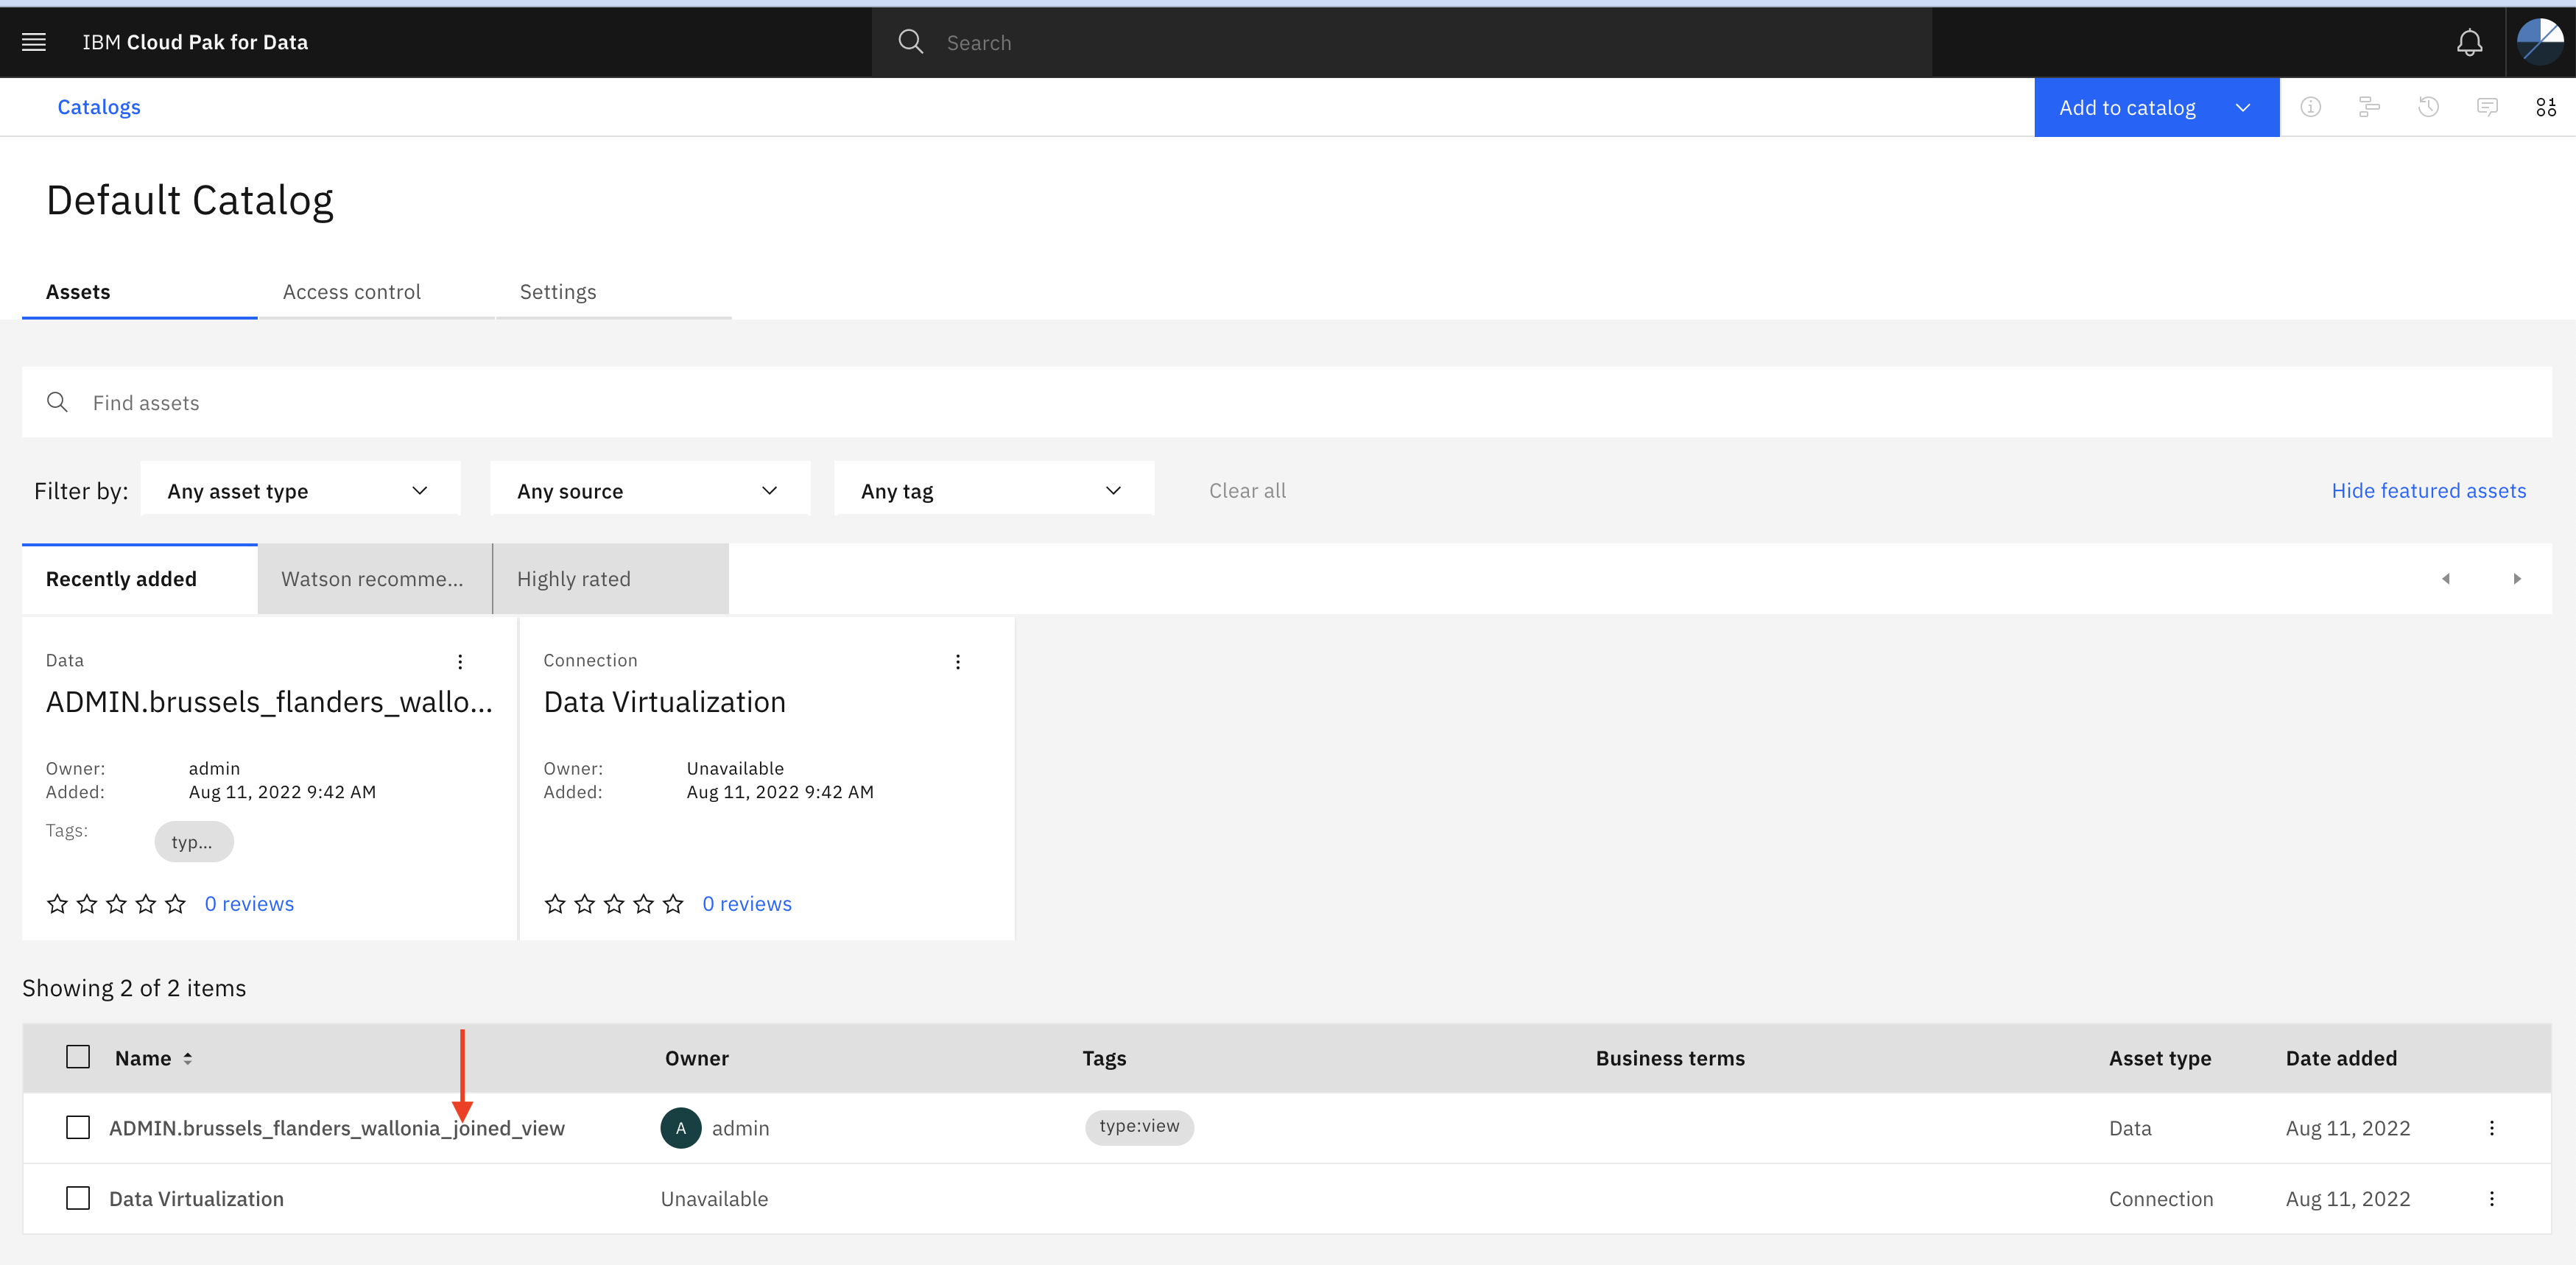
- In the Default Catalog page you will see the joined view (brussels_wallonia_flanders_joined_view) which you have created in the last step. If you noticed view started from ADMIN. which is the username. In your case, it might start with <USER_NAME>.brussels_wallonia_flanders_joined_view.
Click on the view for more details.
- Click Assets tab and provide your Cloud Pak for Data user credentials(userxxxx).
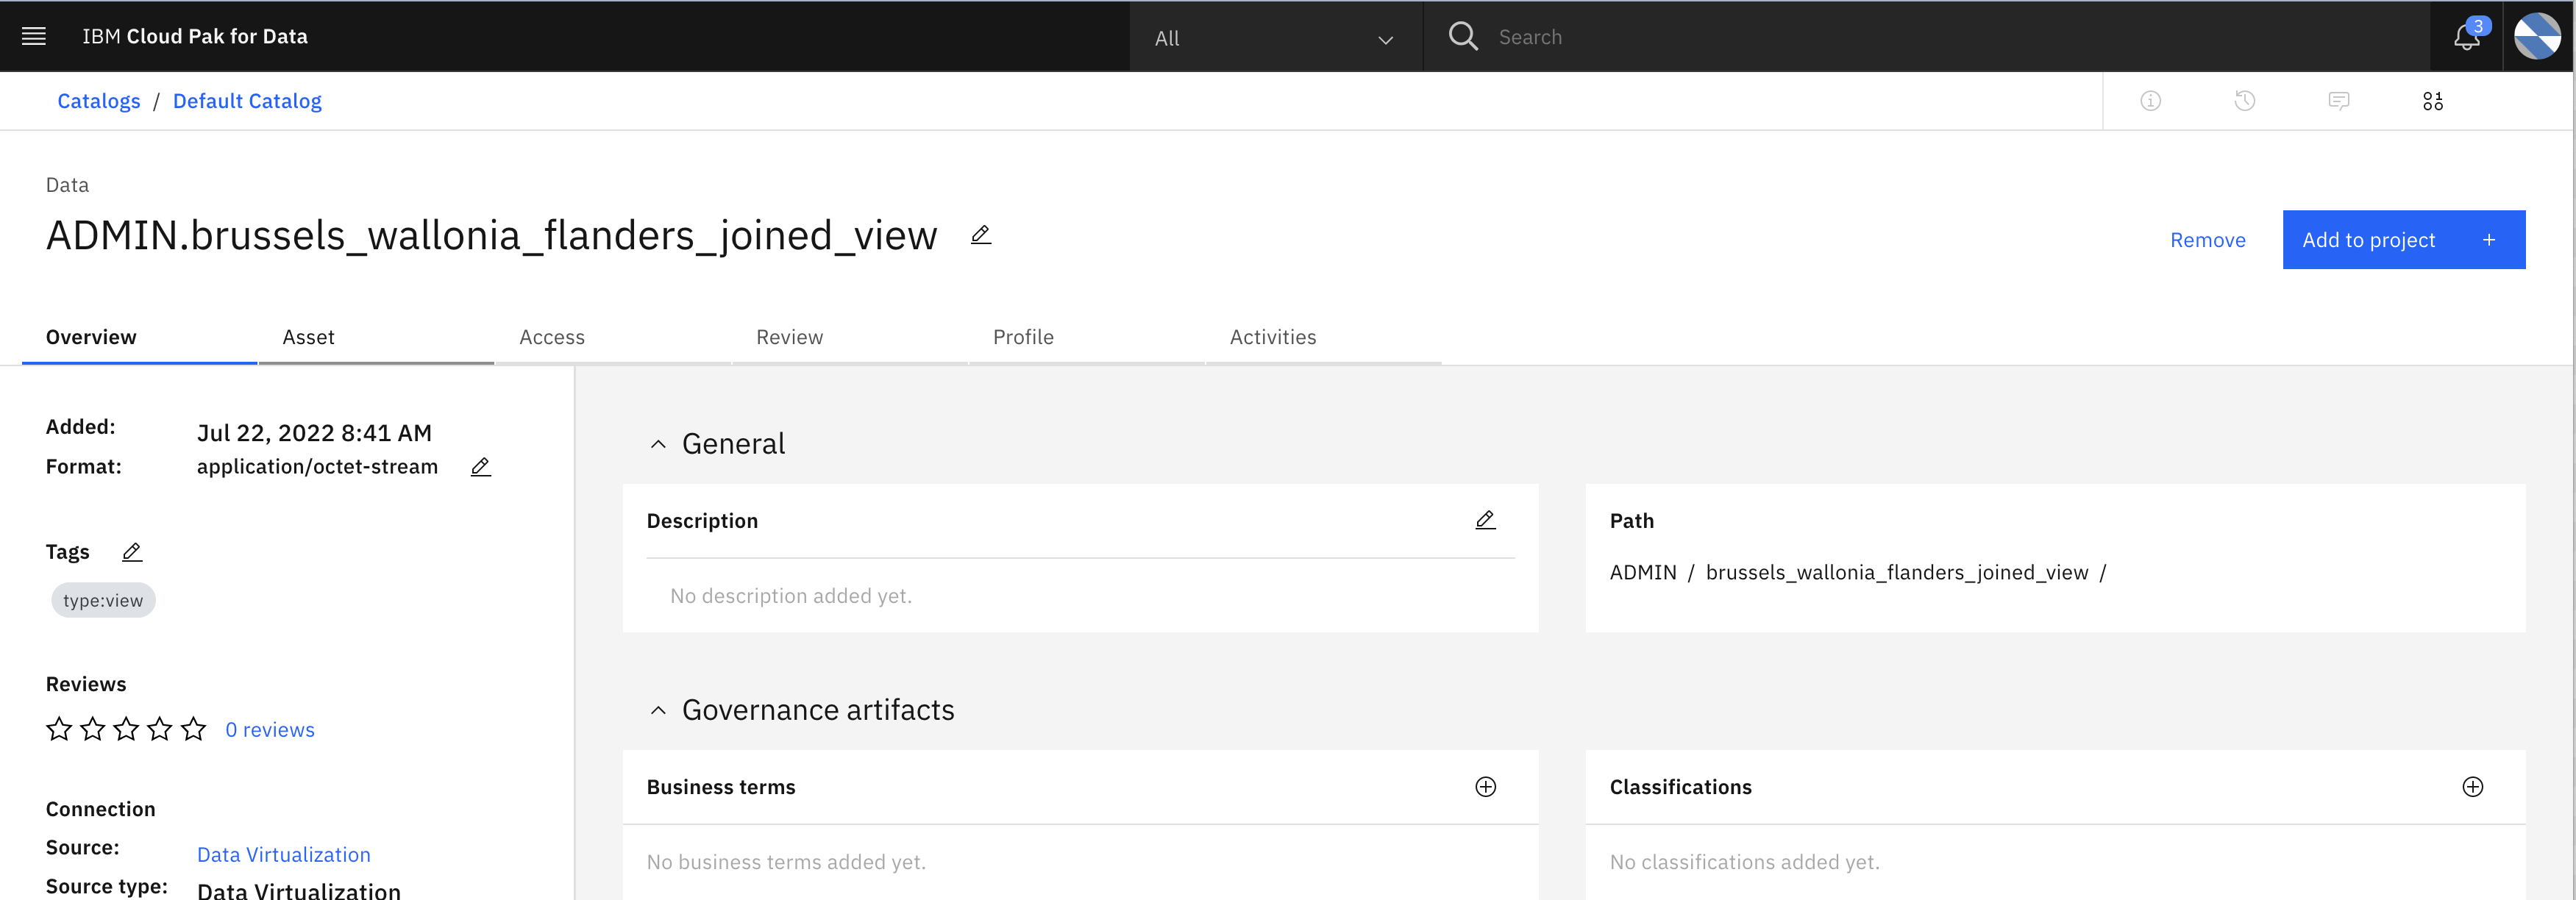
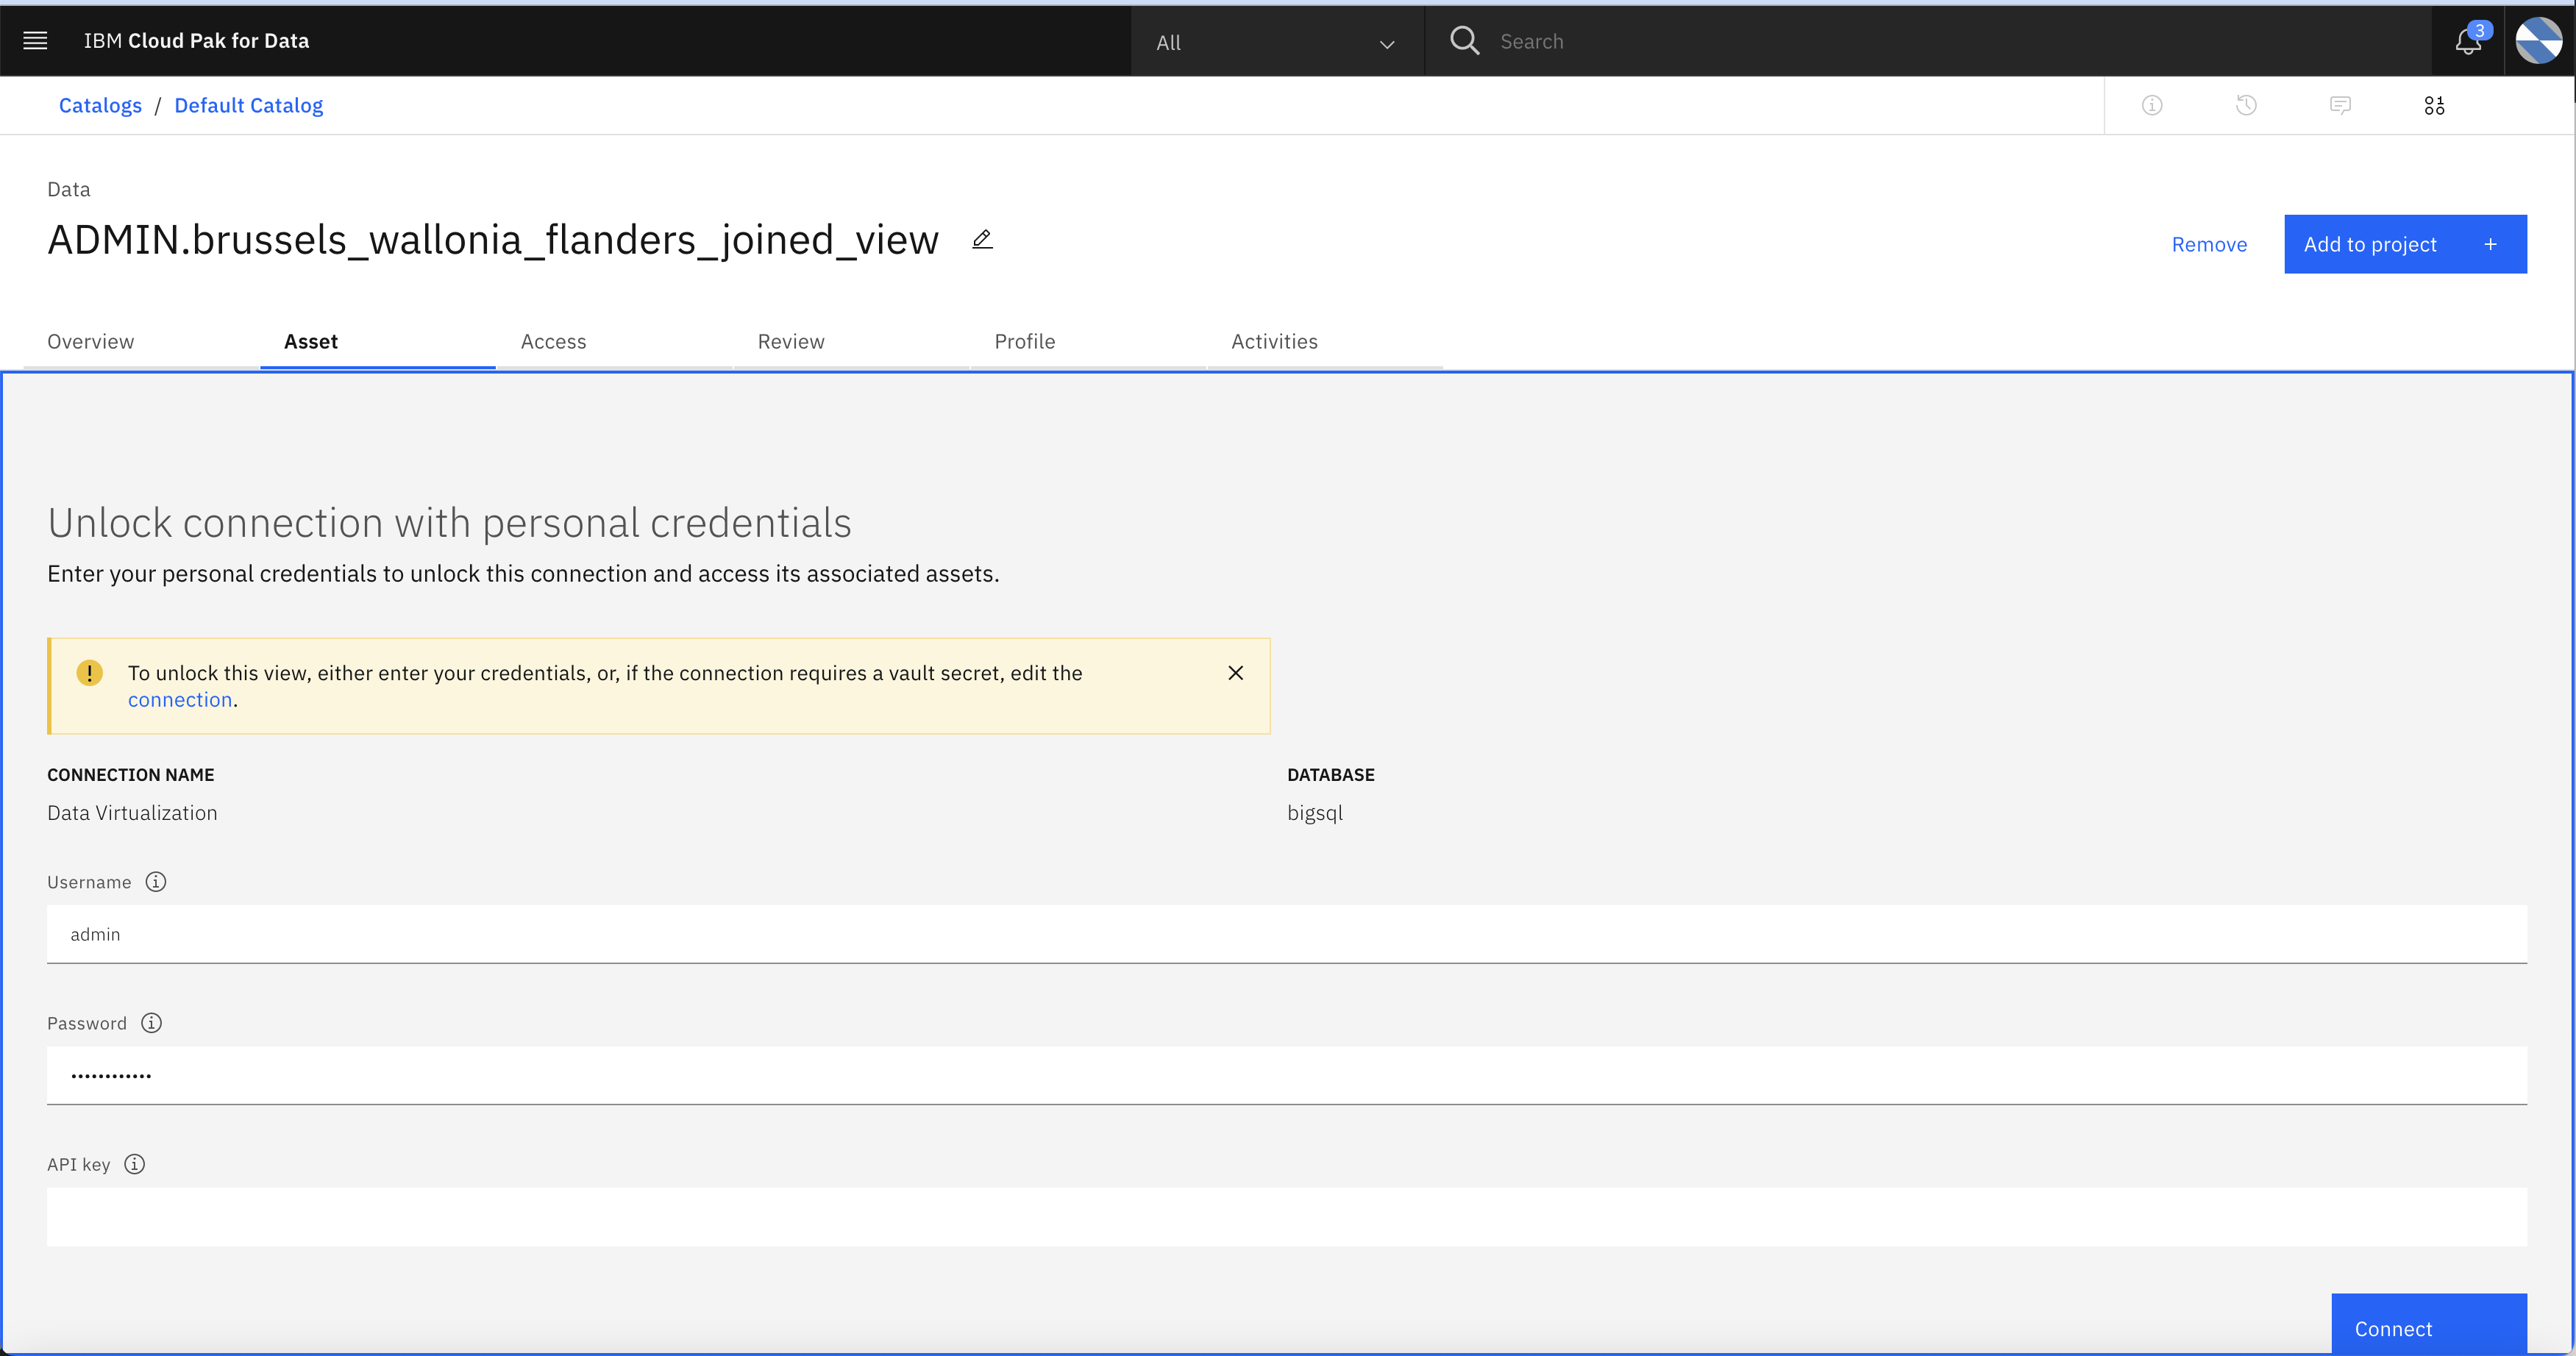
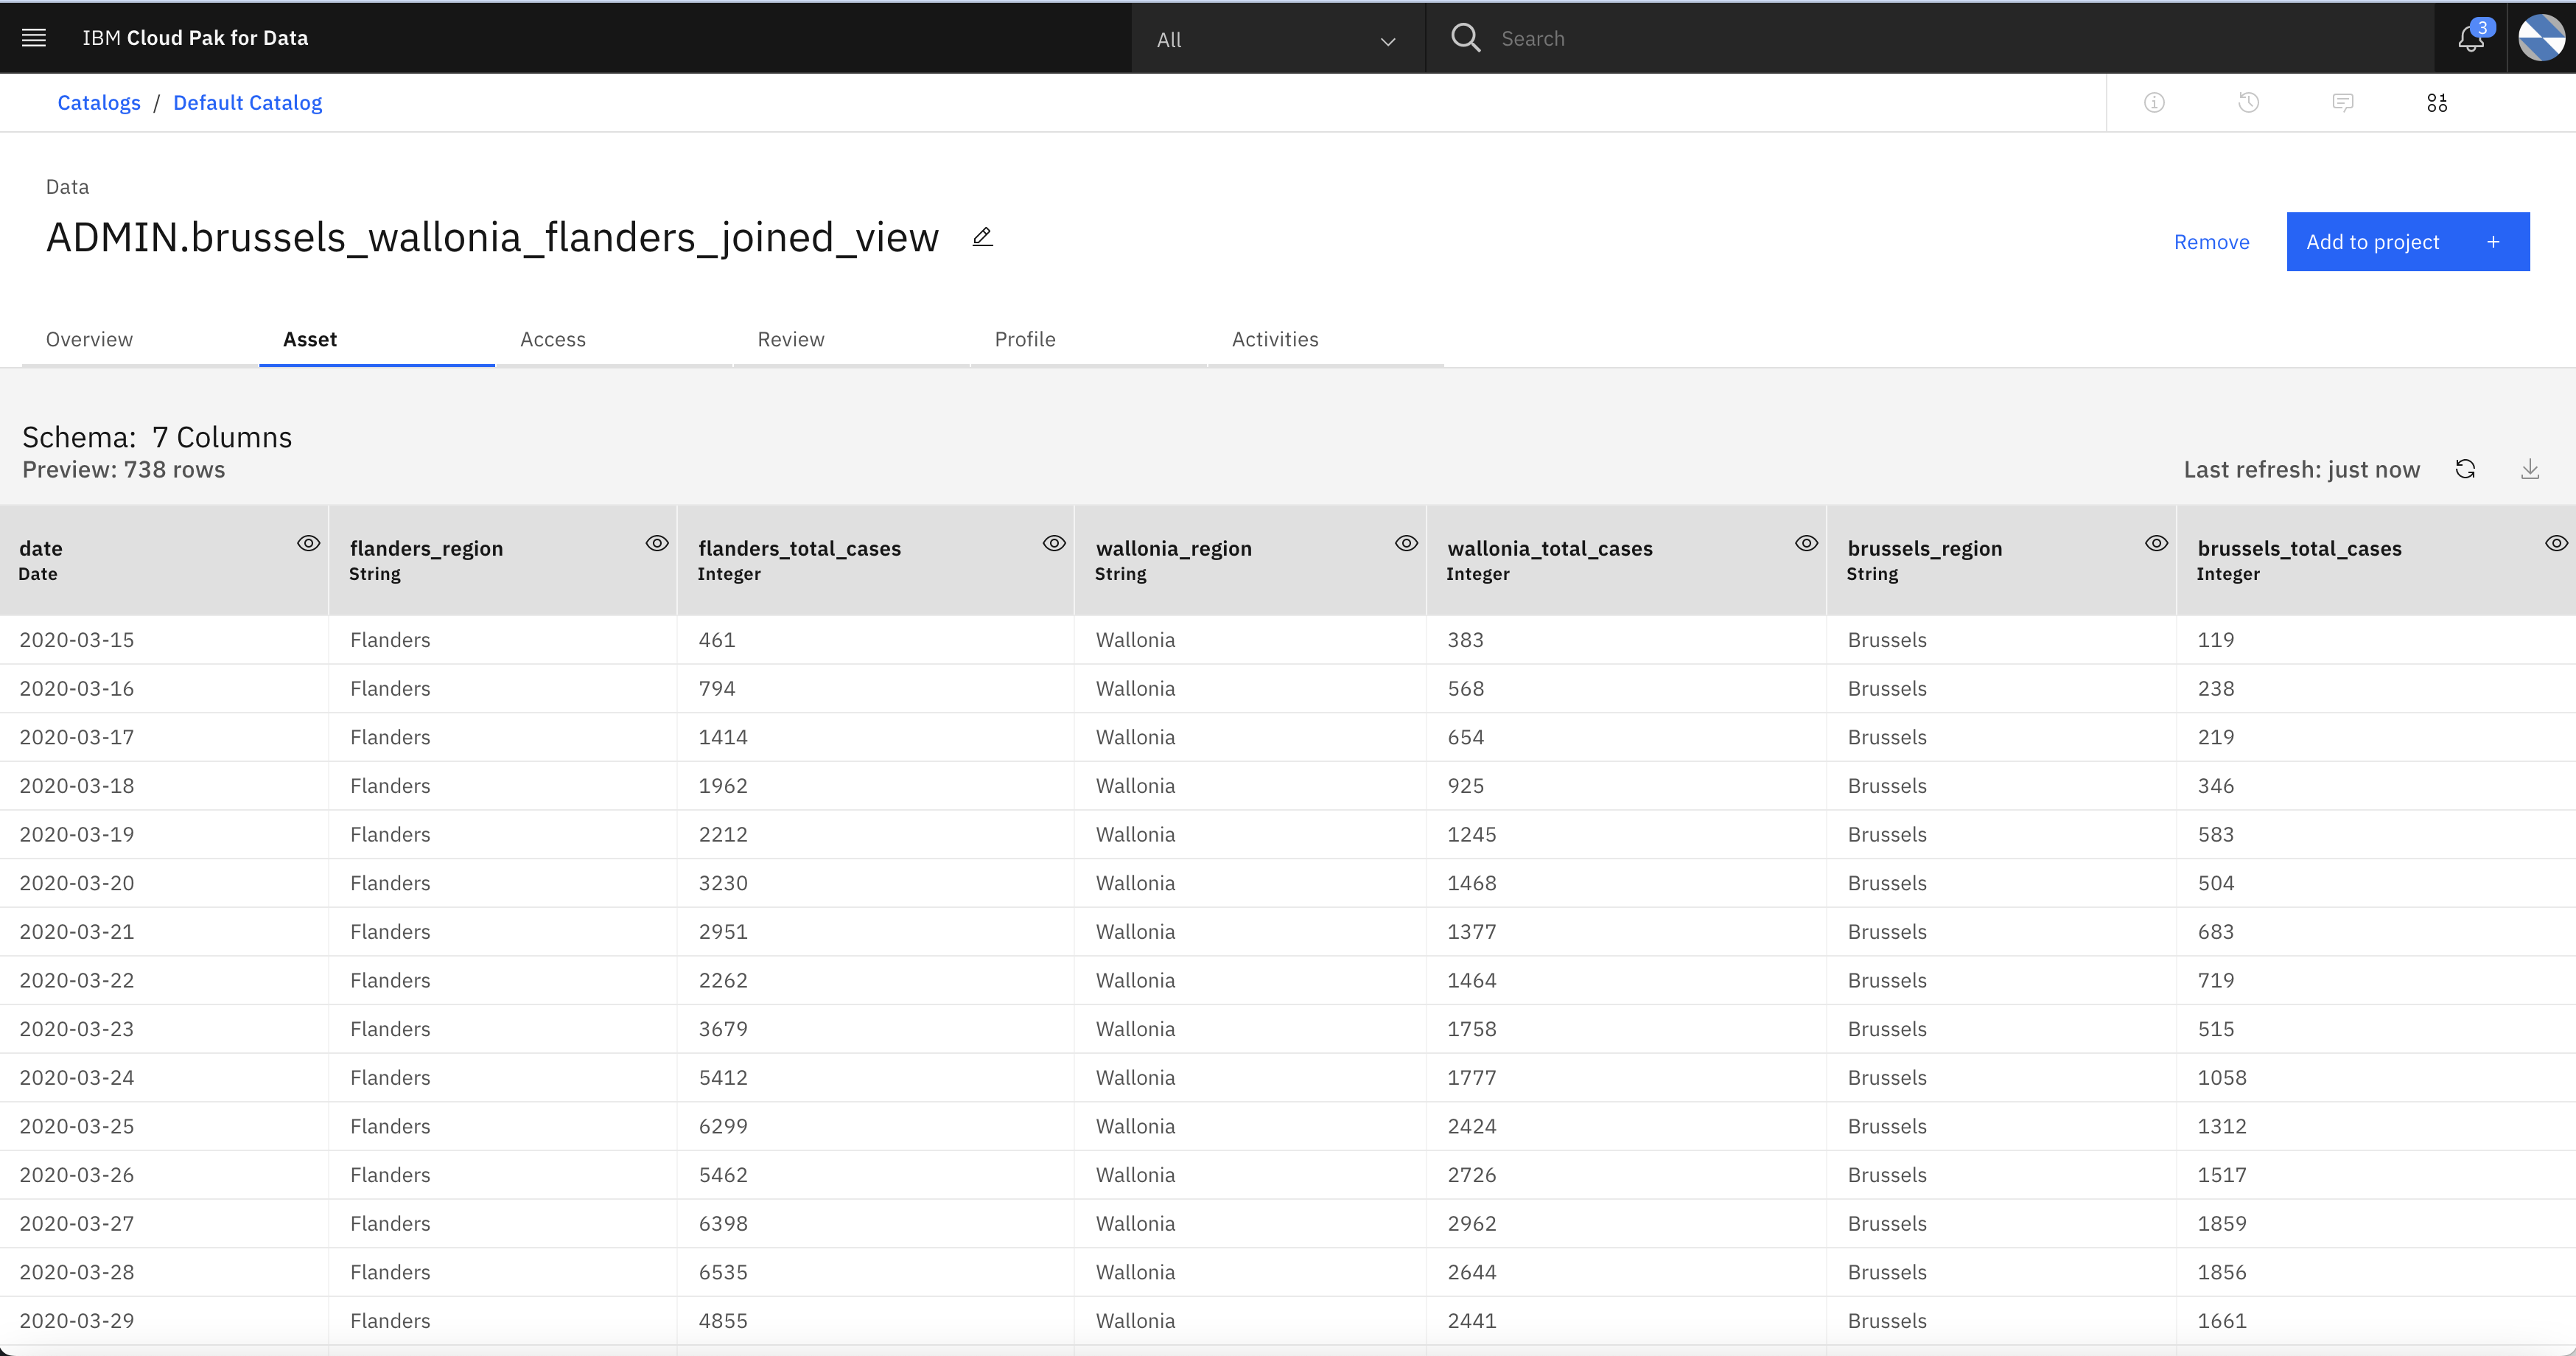
- After successfully validating credentials, you will be able to see the integrated data.
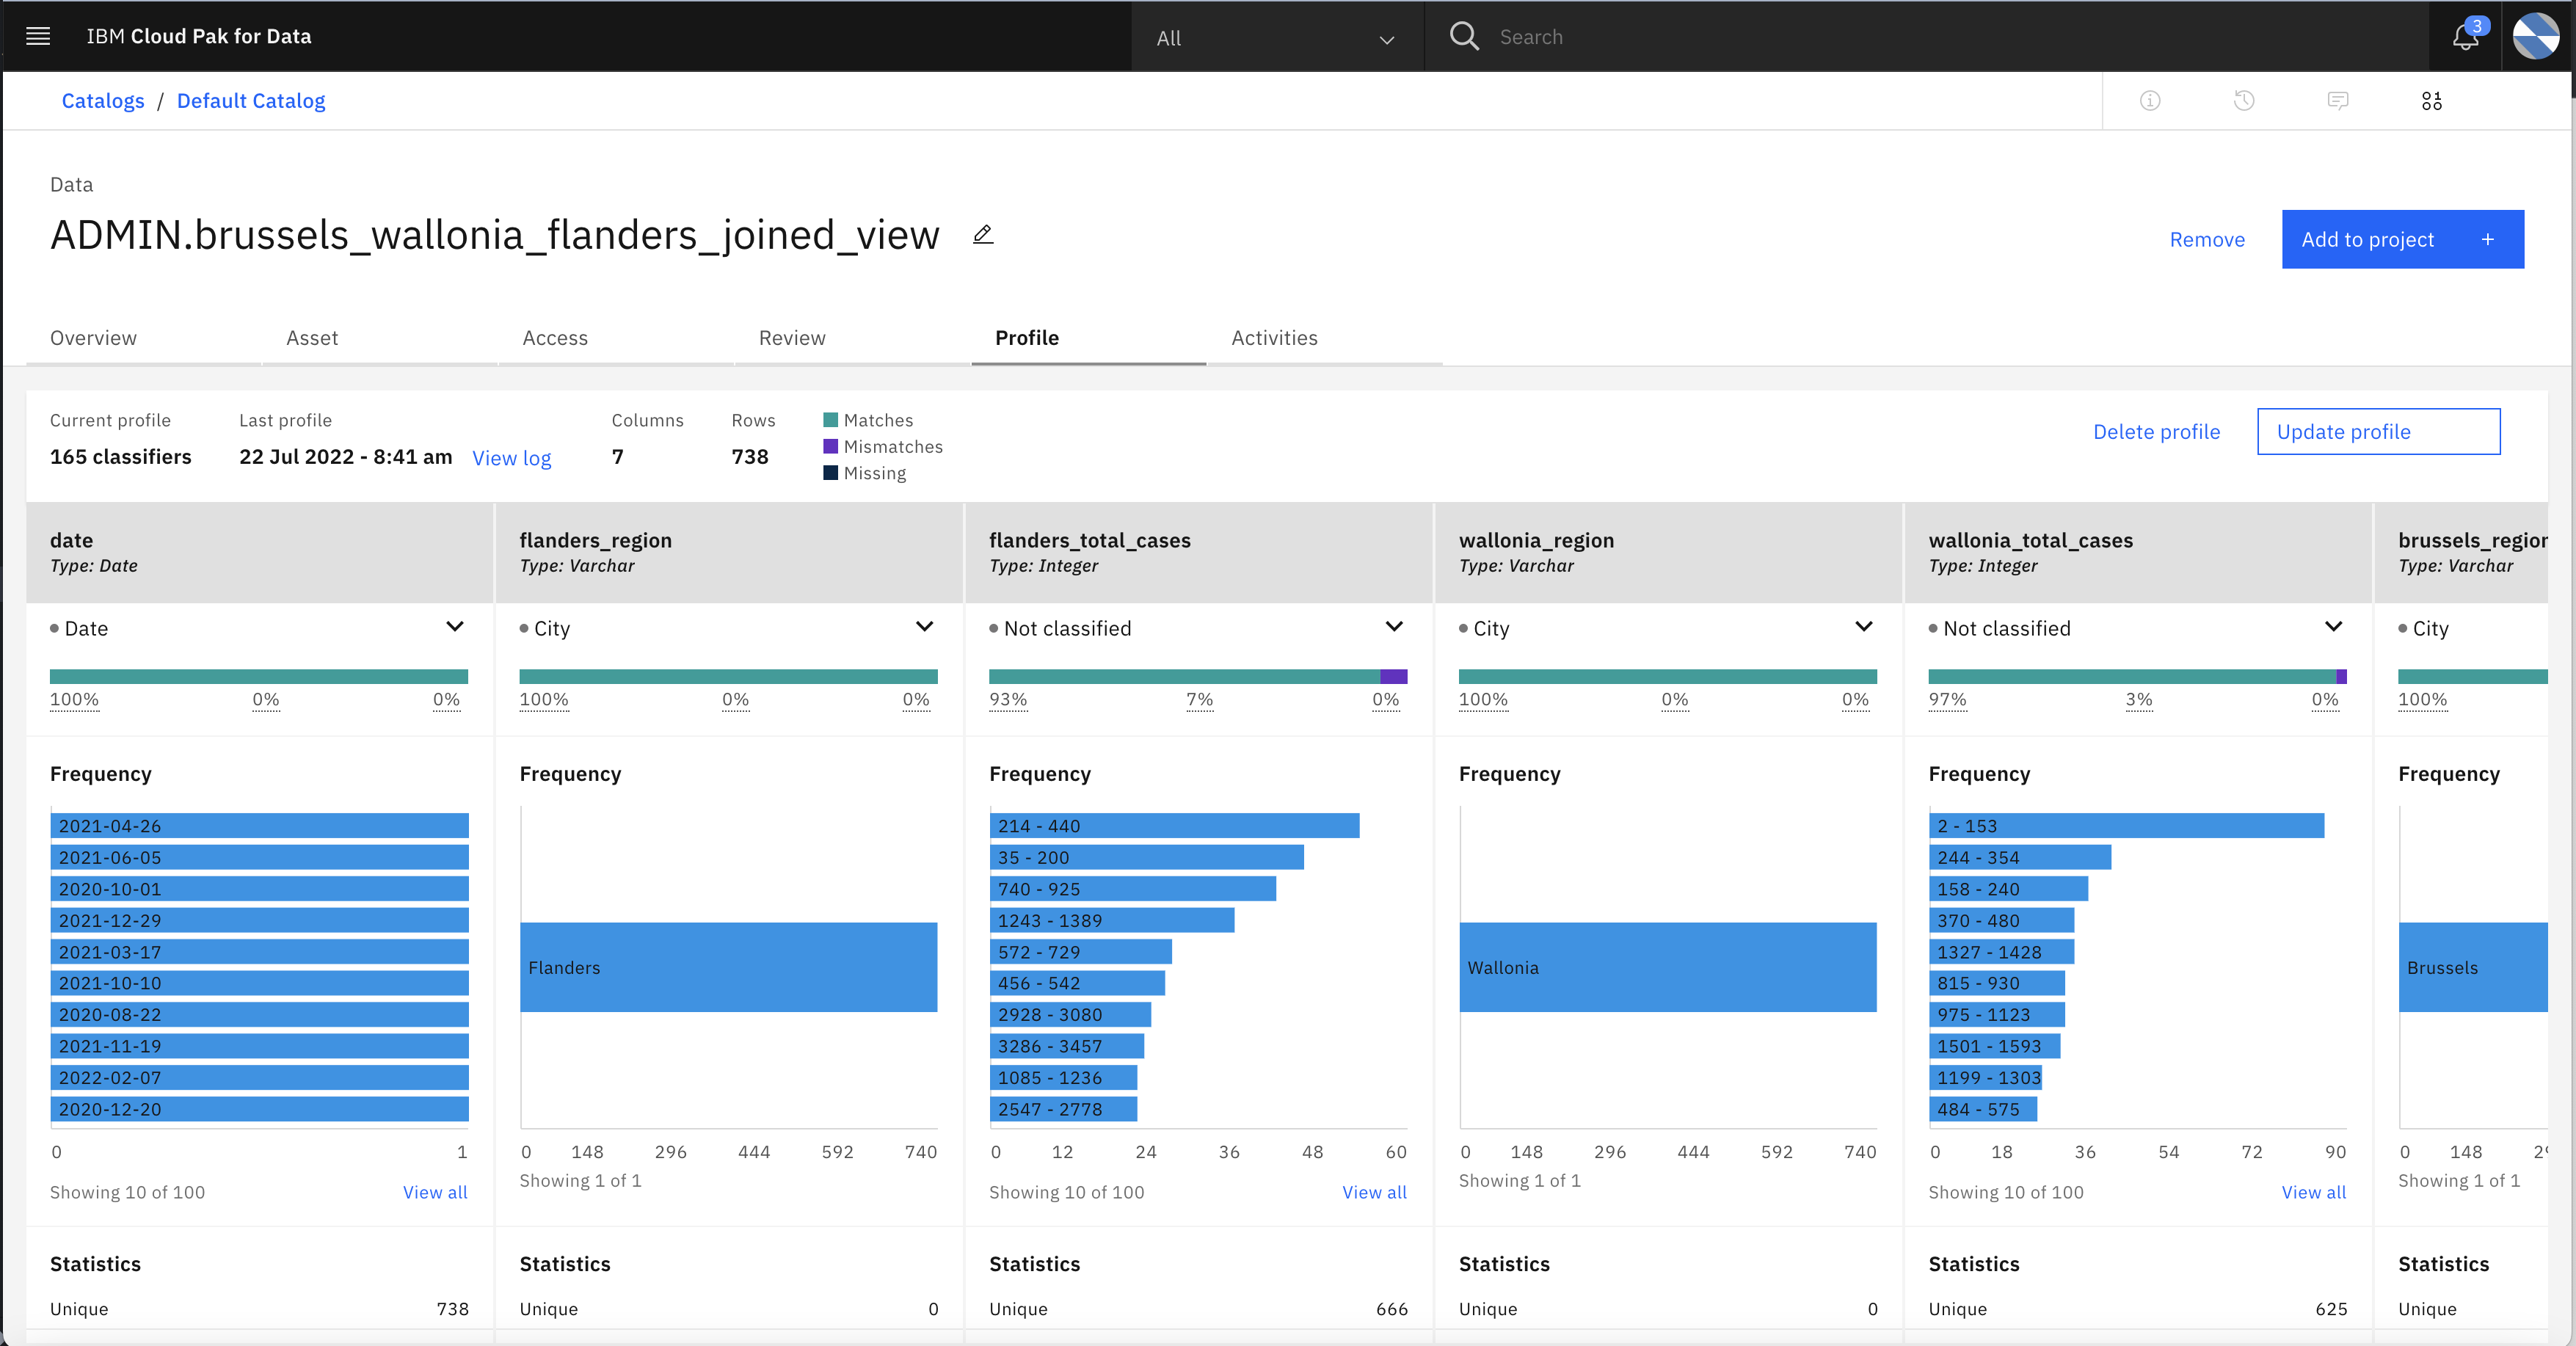
- Click on the Profile tab to get statistics of data inside view.
Summary
This lab you have learned how to use Data Virtualization on IBM Cloud Pak for Data to virtualize data and create merged VIEW to query multiple data sources without moving or copying the data. You have also learned how view can be exported to catalog and how IBM Watson Knowledge Catalog can generate statistics of the data inside view.