Run LSTM Notebook 2
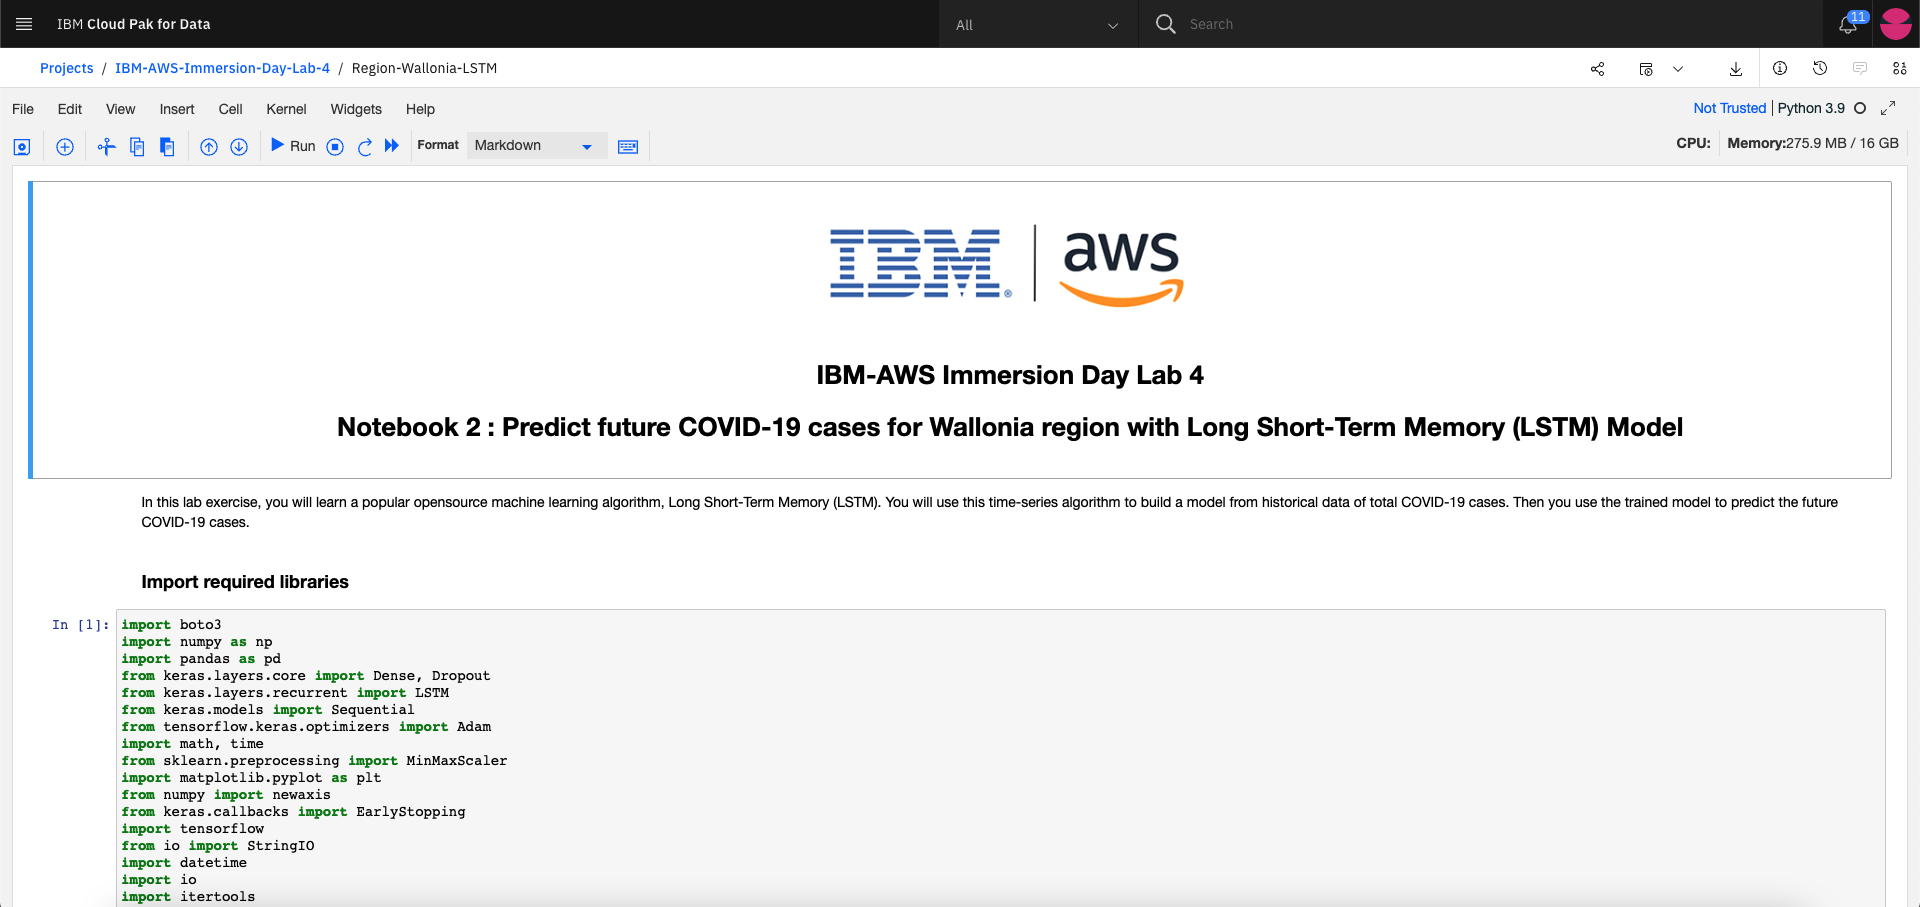
In this lab exercise, you will learn a popular opensource machine learning algorithm, Long Short-Term Memory (LSTM). You will use this time-series algorithm to build a model from historical data of total COVID-19 cases. Then you use the trained model to predict the future COVID-19 cases.
Notebook 2 : Predict future COVID-19 cases for Wallonia region with Long Short-Term Memory (LSTM) Model
-
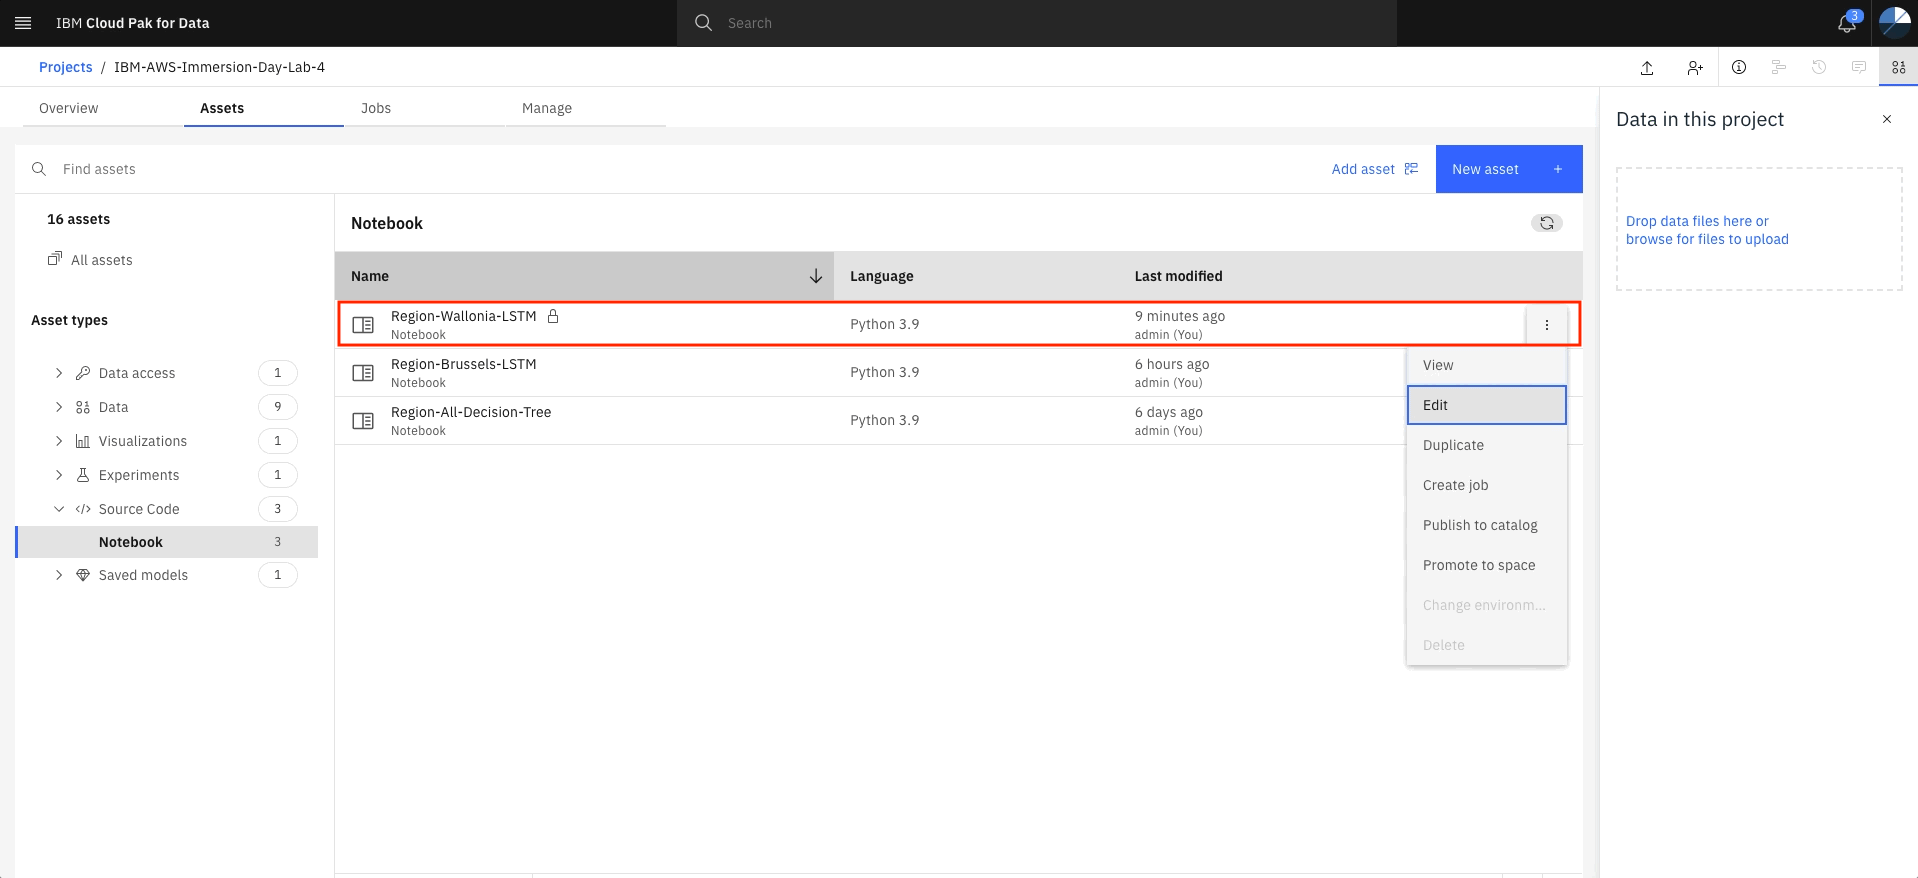
In Cloud Pak for Data, click on the Assets tab on top, under Asset types expand the Source code tab and select Notebook.
-
You will see the three notebooks listed. You will refer to the Region-Wallonia-LSTM.ipynb notebook.
-
Click on the three dot menu and select edit to get started.
-
The notebook should look something as shown below.
- You need to add the S3 connection to the notebook.
- Click on the empty second code cell in the notebook.
- Click on find and add data button on top right.
- Click on Connections tab.
- You will see your connection variable. Click on Insert to code and select pandas DataFrame.
- Select the ts-wallonia-grouped.csv dataset from the connection variable.
- Verify the dataframe name to be
data_df_1in the generated code snippet.
-
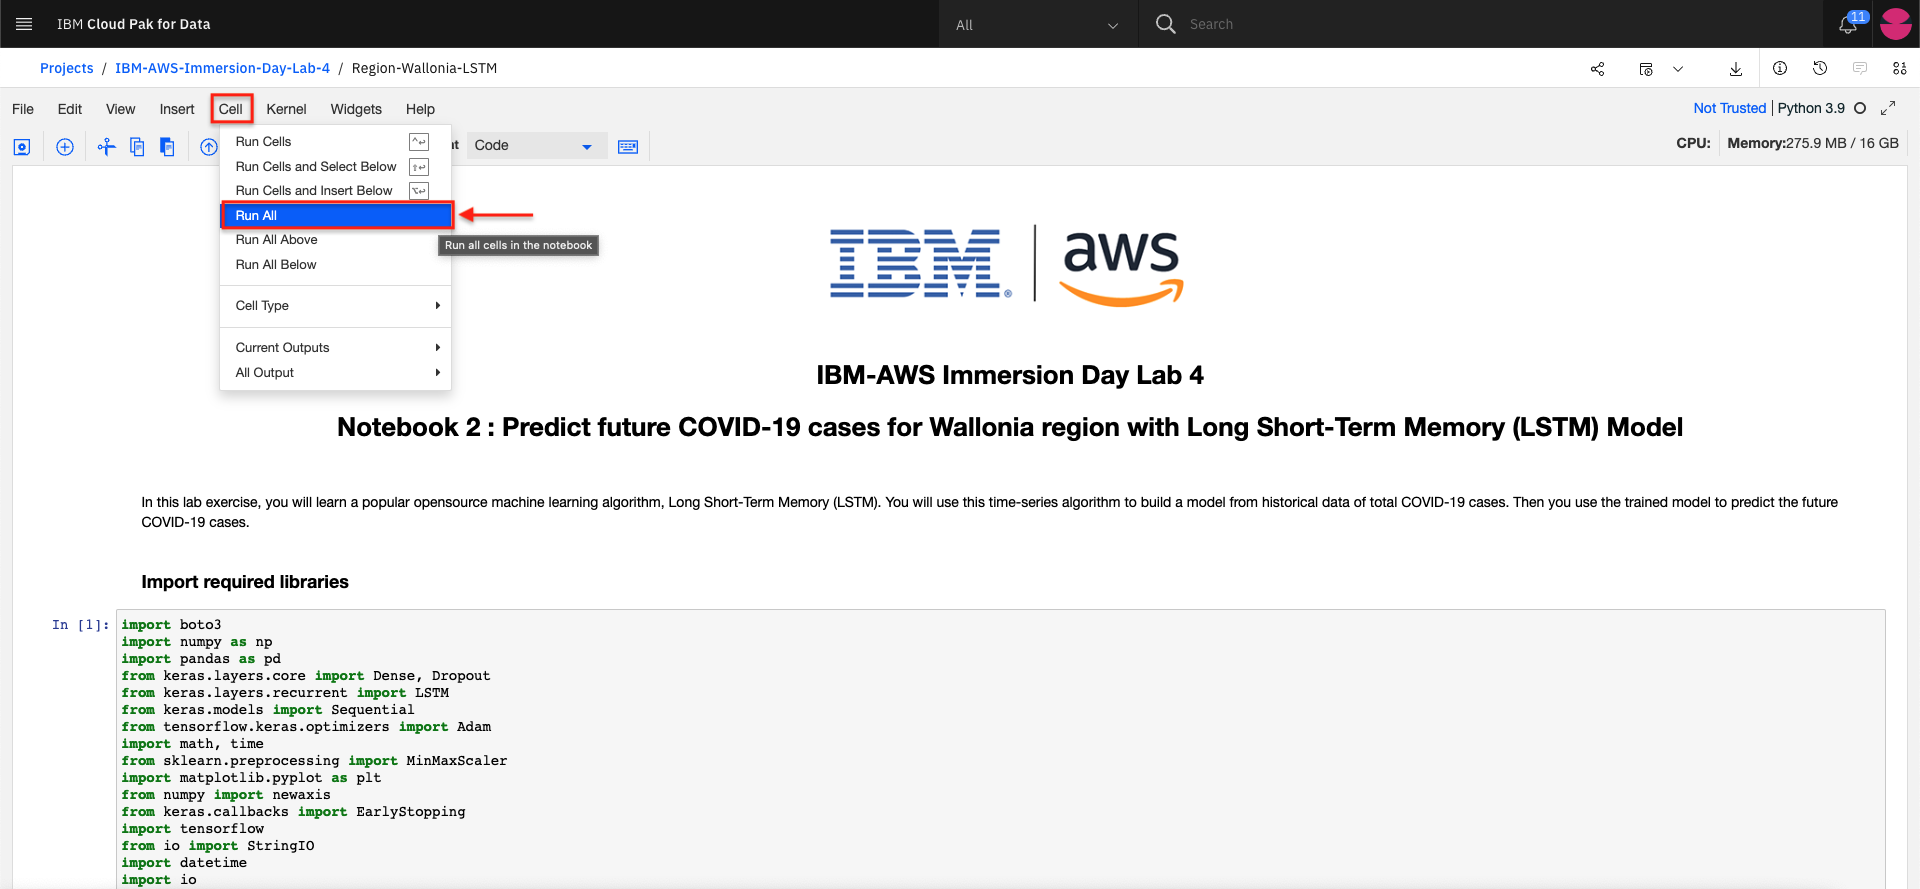
Click on Cell on top and select Run All to run the notebook.
-
This will run the notebook, it will take some time please be patient.
-
Once the notebook is completed you can observe the following in the notebook:
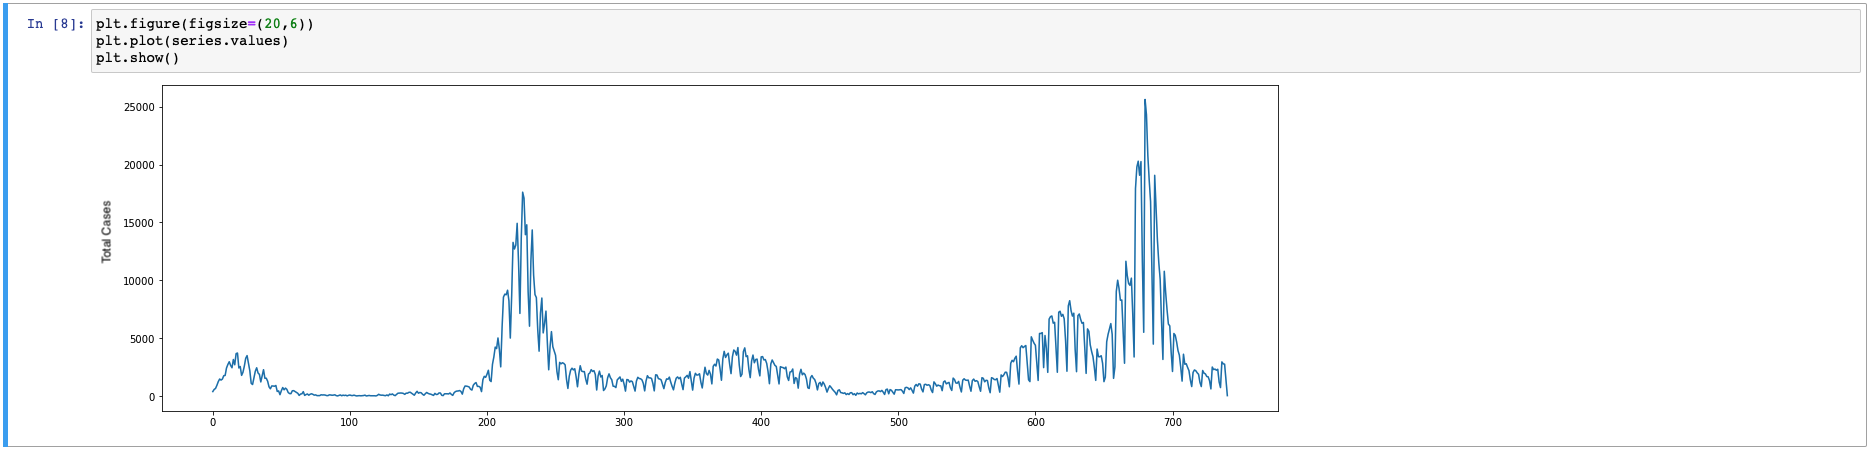
- Current Trend of COVID-19 cases in Brussels
- LSTM Model Accuracy
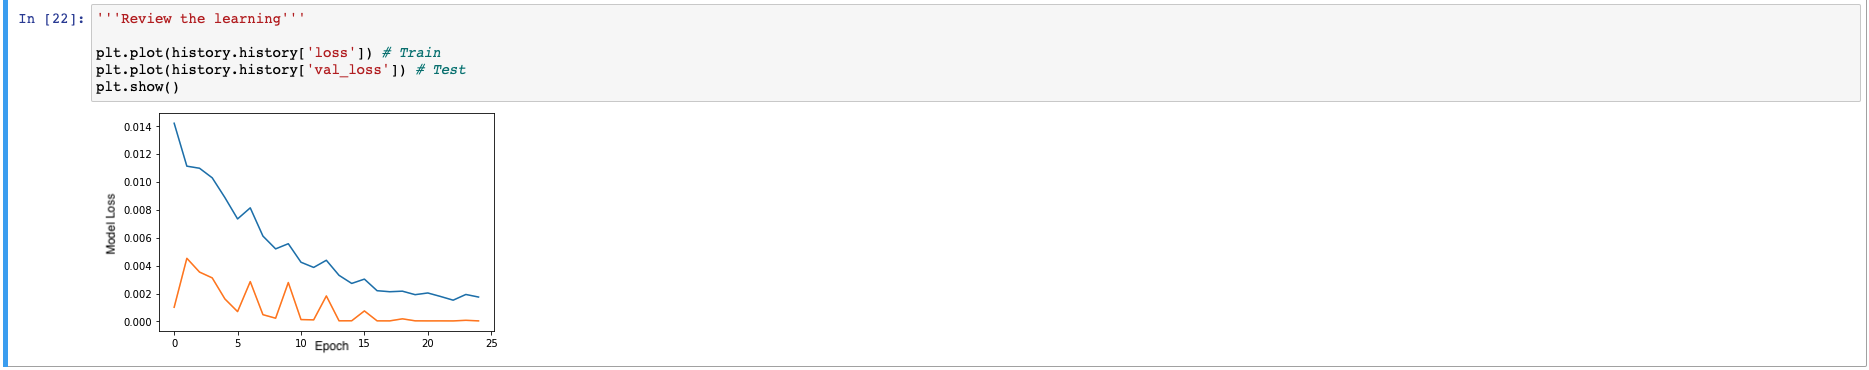
- LSTM Model Loss
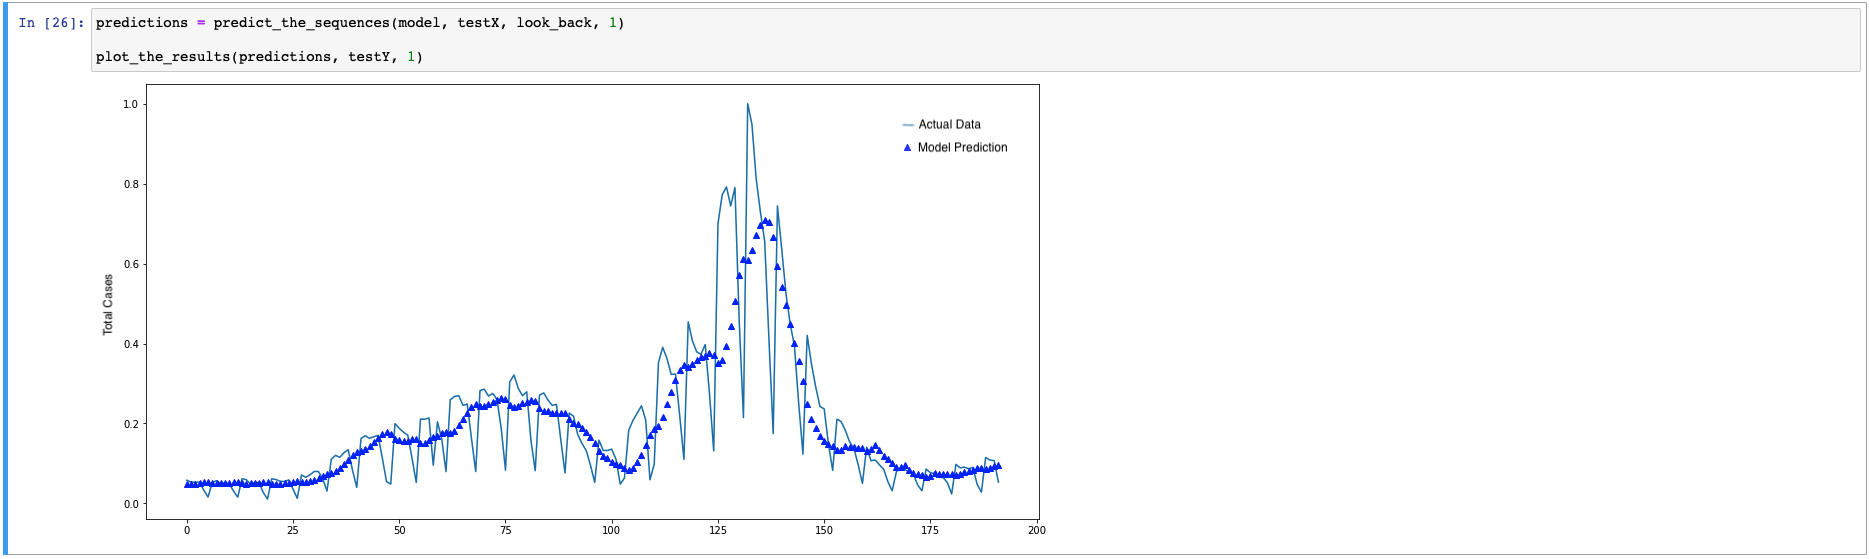
- LSTM Model Prediction
-
Current Trend of COVID-19 cases in Brussels: The current trend of COVID-19 cases in Brussels is shown in the graph.
-
LSTM Model Accuracy: You can observe the Root Mean Squared Error (RMSE) values are almost similar for training & test data which confirms the accuracy of the model without overfitting or underfitting.

-
LSTM Model Loss: There’s no vanishing gradient descent as the LSTM model with optimal configueration has taken care of the gradient descent problem.
-
LSTM Model Prediction: You can observe the model is able to catch the pattern in the data.
-
The following CSV files are generated from the notebook:
- Wallonia.csv: This is the dataframe containing the historical COVID-19 cases in Wallonia.
- wallonia-actualVsPredicted.csv: This is the dataframe containing the actual and predicted COVID-19 cases in Wallonia.
- wallonia-errorEvaluation.csv: This is the dataframe containing the error evaluation of the model.
- wallonia-next7Prediction.csv: This is the dataframe containing the next 7 days prediction of COVID-19 cases in Wallonia.
- These CSV files will be stored to your S3 bucket and Data Assets in your Cloud Pak for Data project.
These CSV files will be used to Visualize the Data in Watson Cognos Dashboard Embedded
You have successfully completed this lab exercise. You can continue to the next lab exercise.