Create and visualize IBM Cognos Analytics dashboard
IBM® Cognos® Analytics integrates reporting, modeling, analysis, dashboards, stories, and event management so that you can understand your organization data, and make effective business decisions. After the software is installed and configured on Cloud pak for data, administrators set up security and manage data sources.
In this section we will use a Dashboard module which provides users a way to communicate insights and analysis of their data. A dashboard view contains visualizations such as graphs, charts, plots, table, maps, or any other visual representation of data.
Create a Dashboard
-
From the Cognos Analytics home page, select the + New icon in the lower left corner. Select Dashboard. Select the default template and click on Create.
-
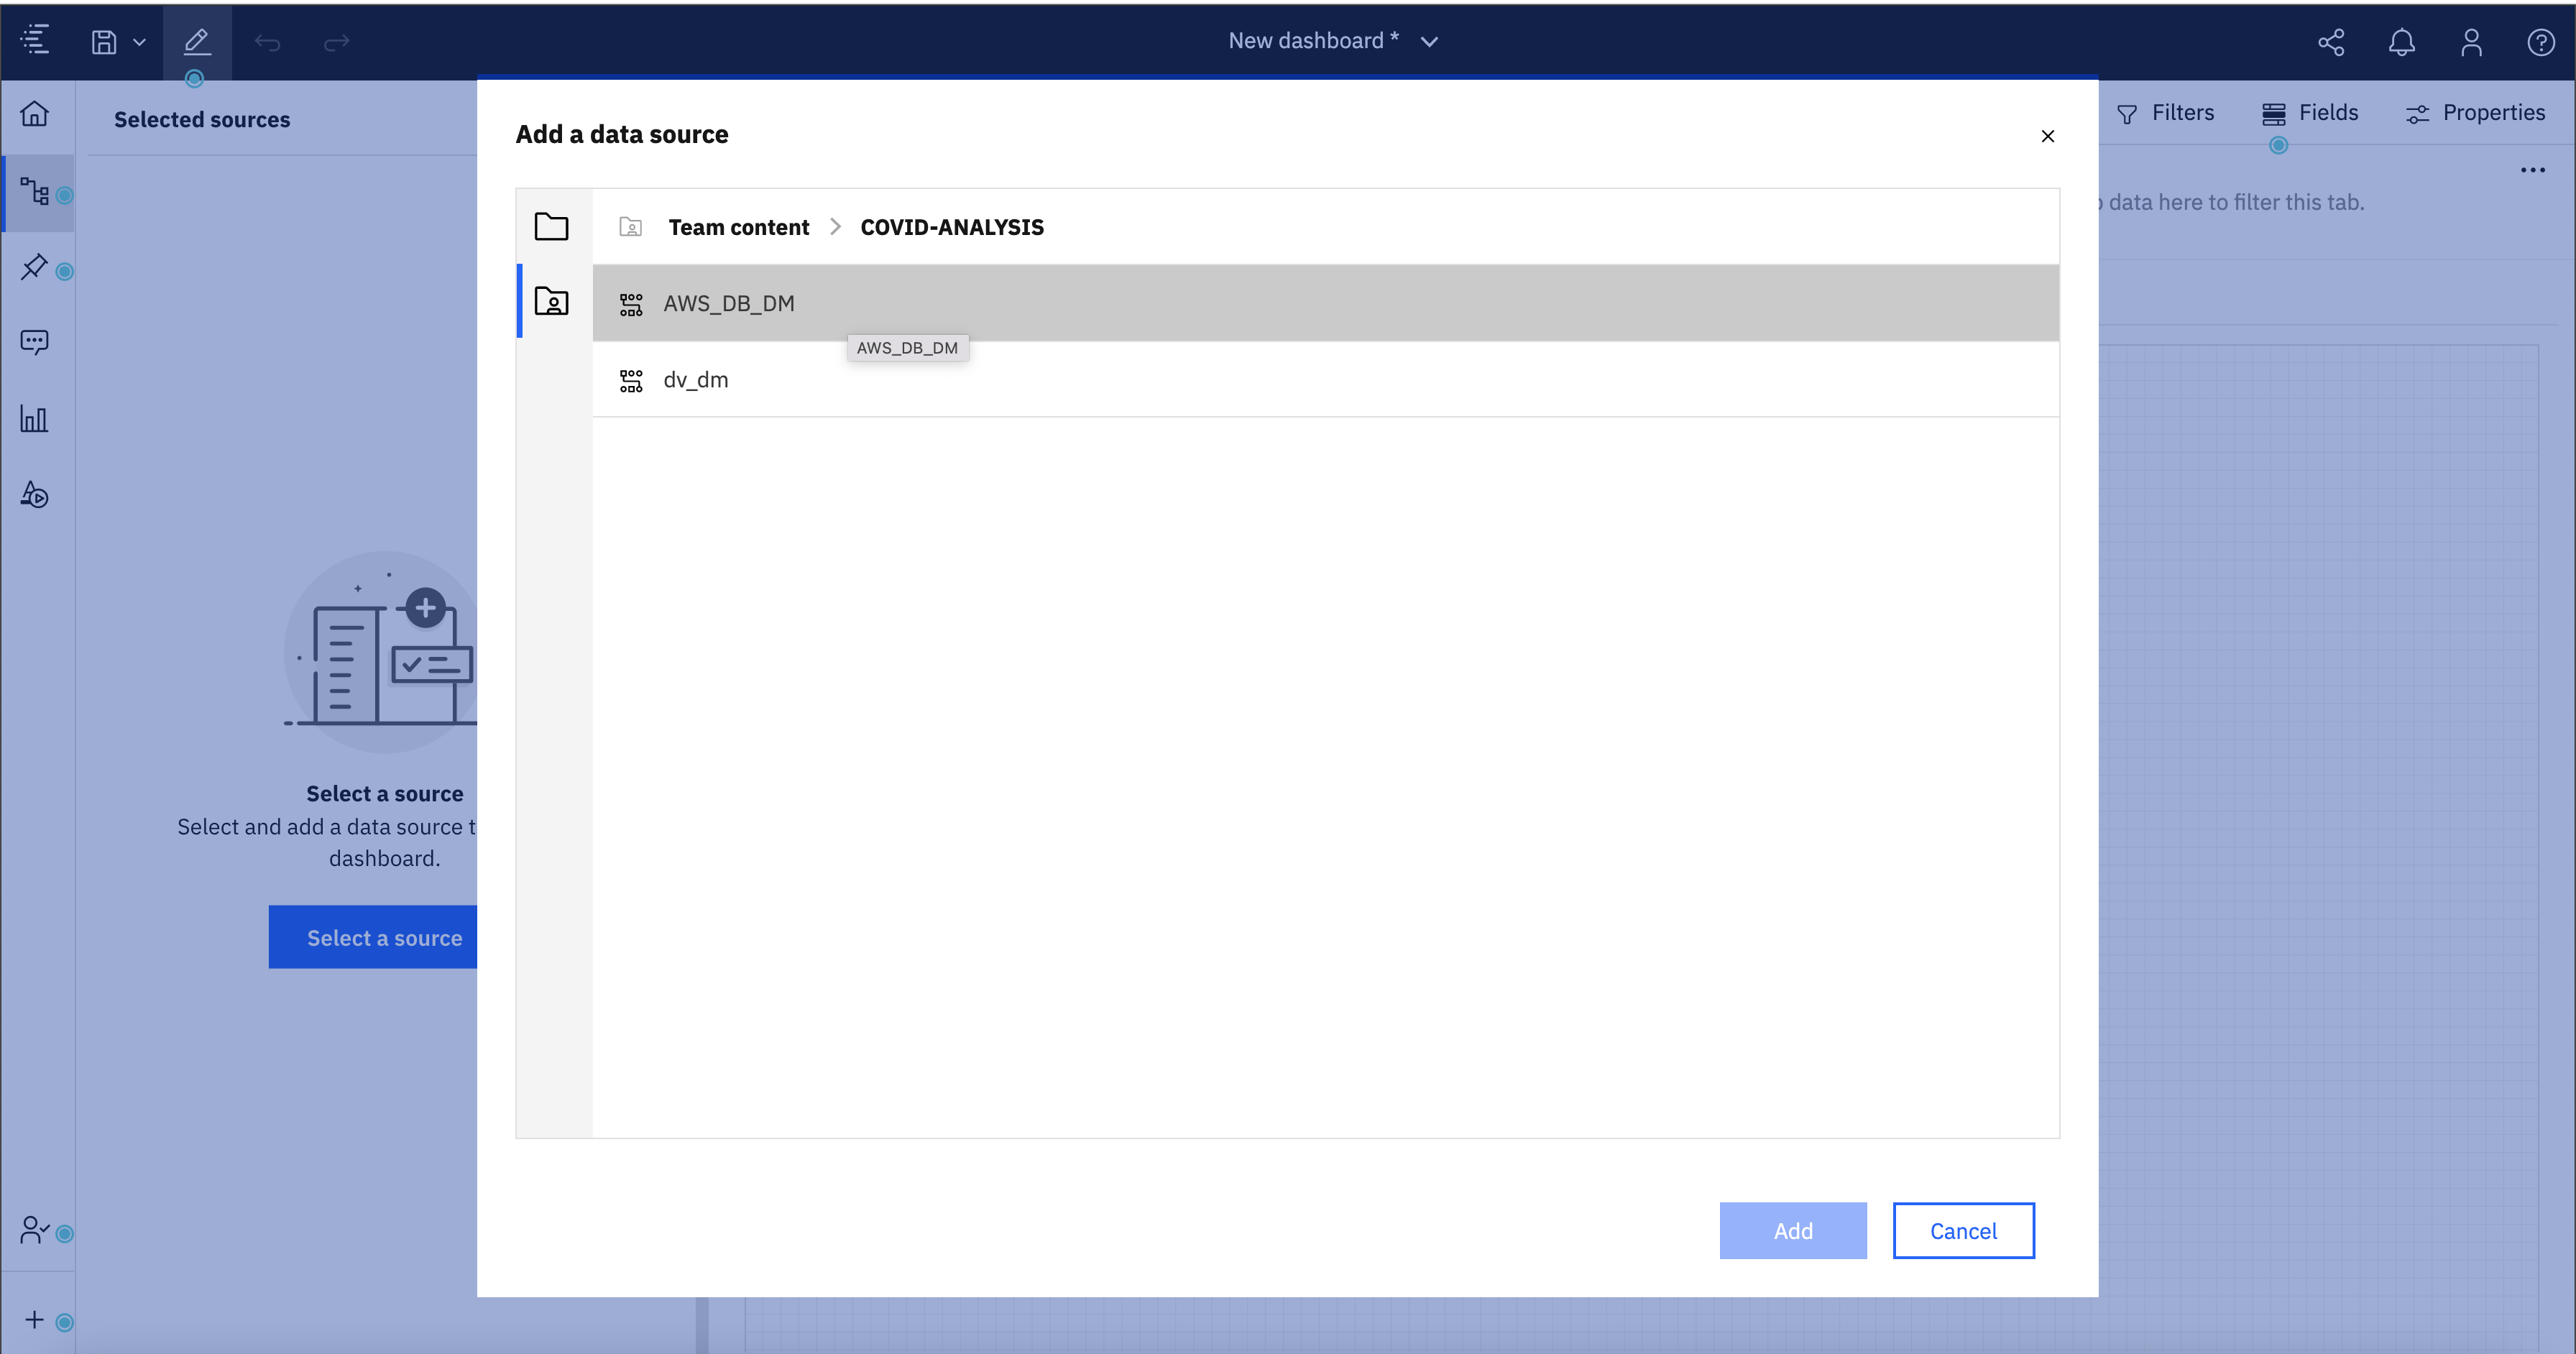
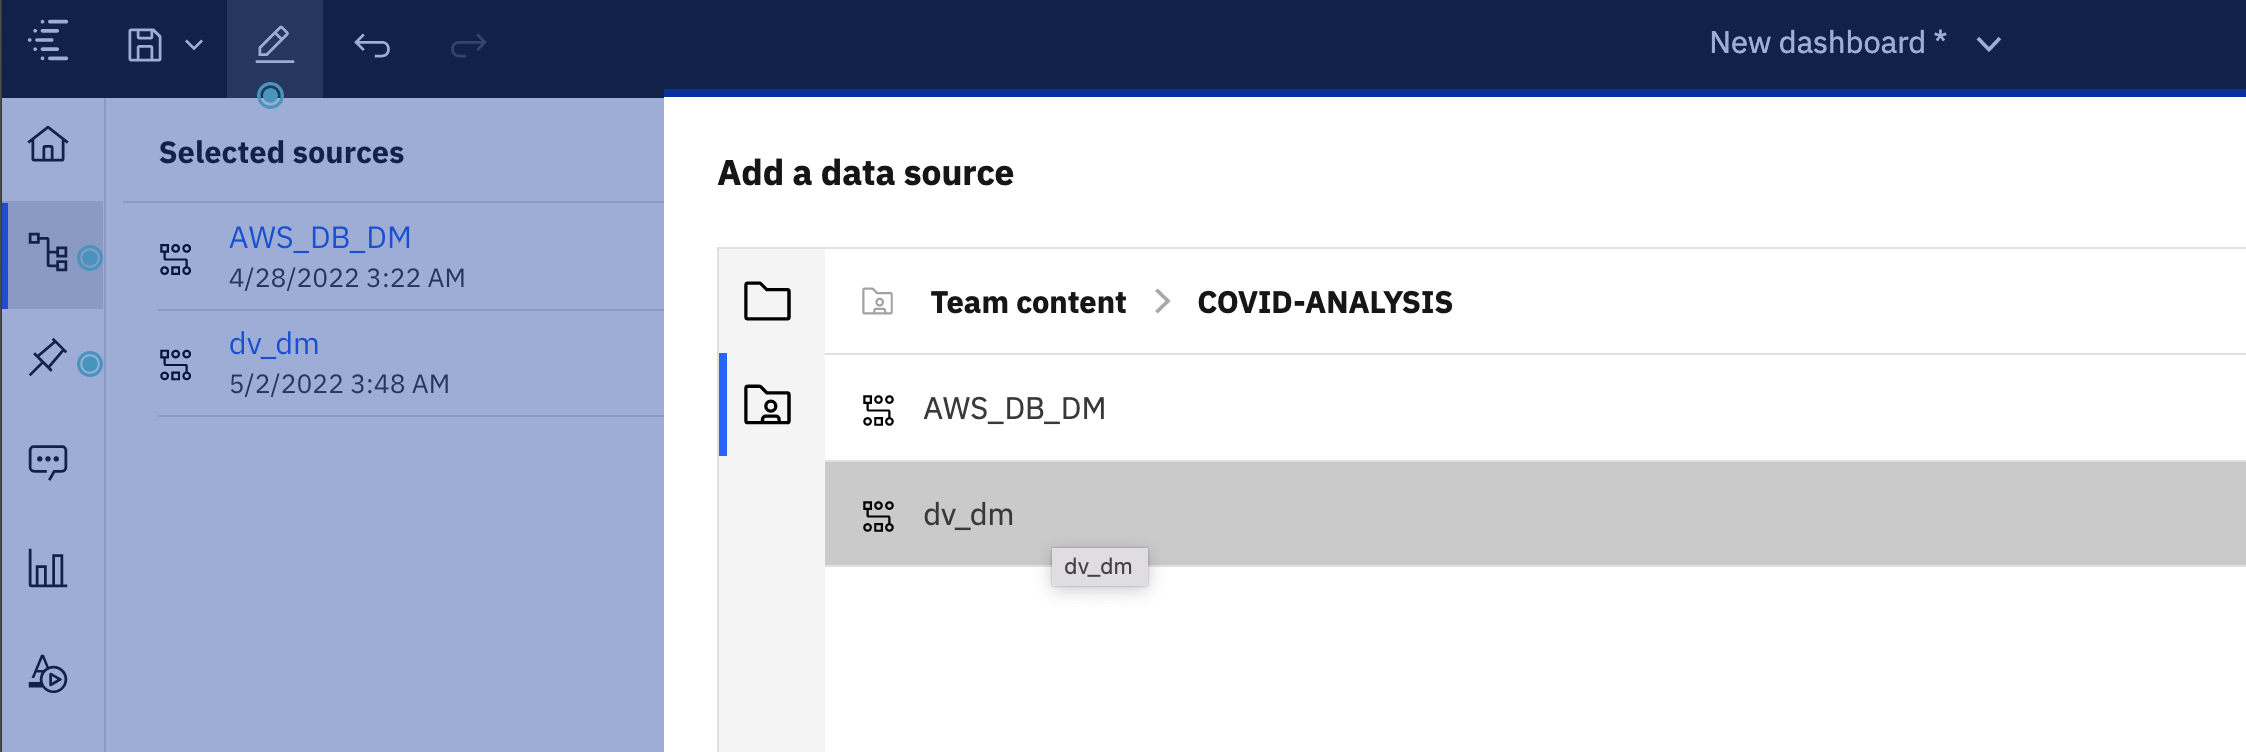
Click Select a source and Select the Data module you just created in the previous section, and click Add.
- Now you should see a blank canvas to create your dashboard.
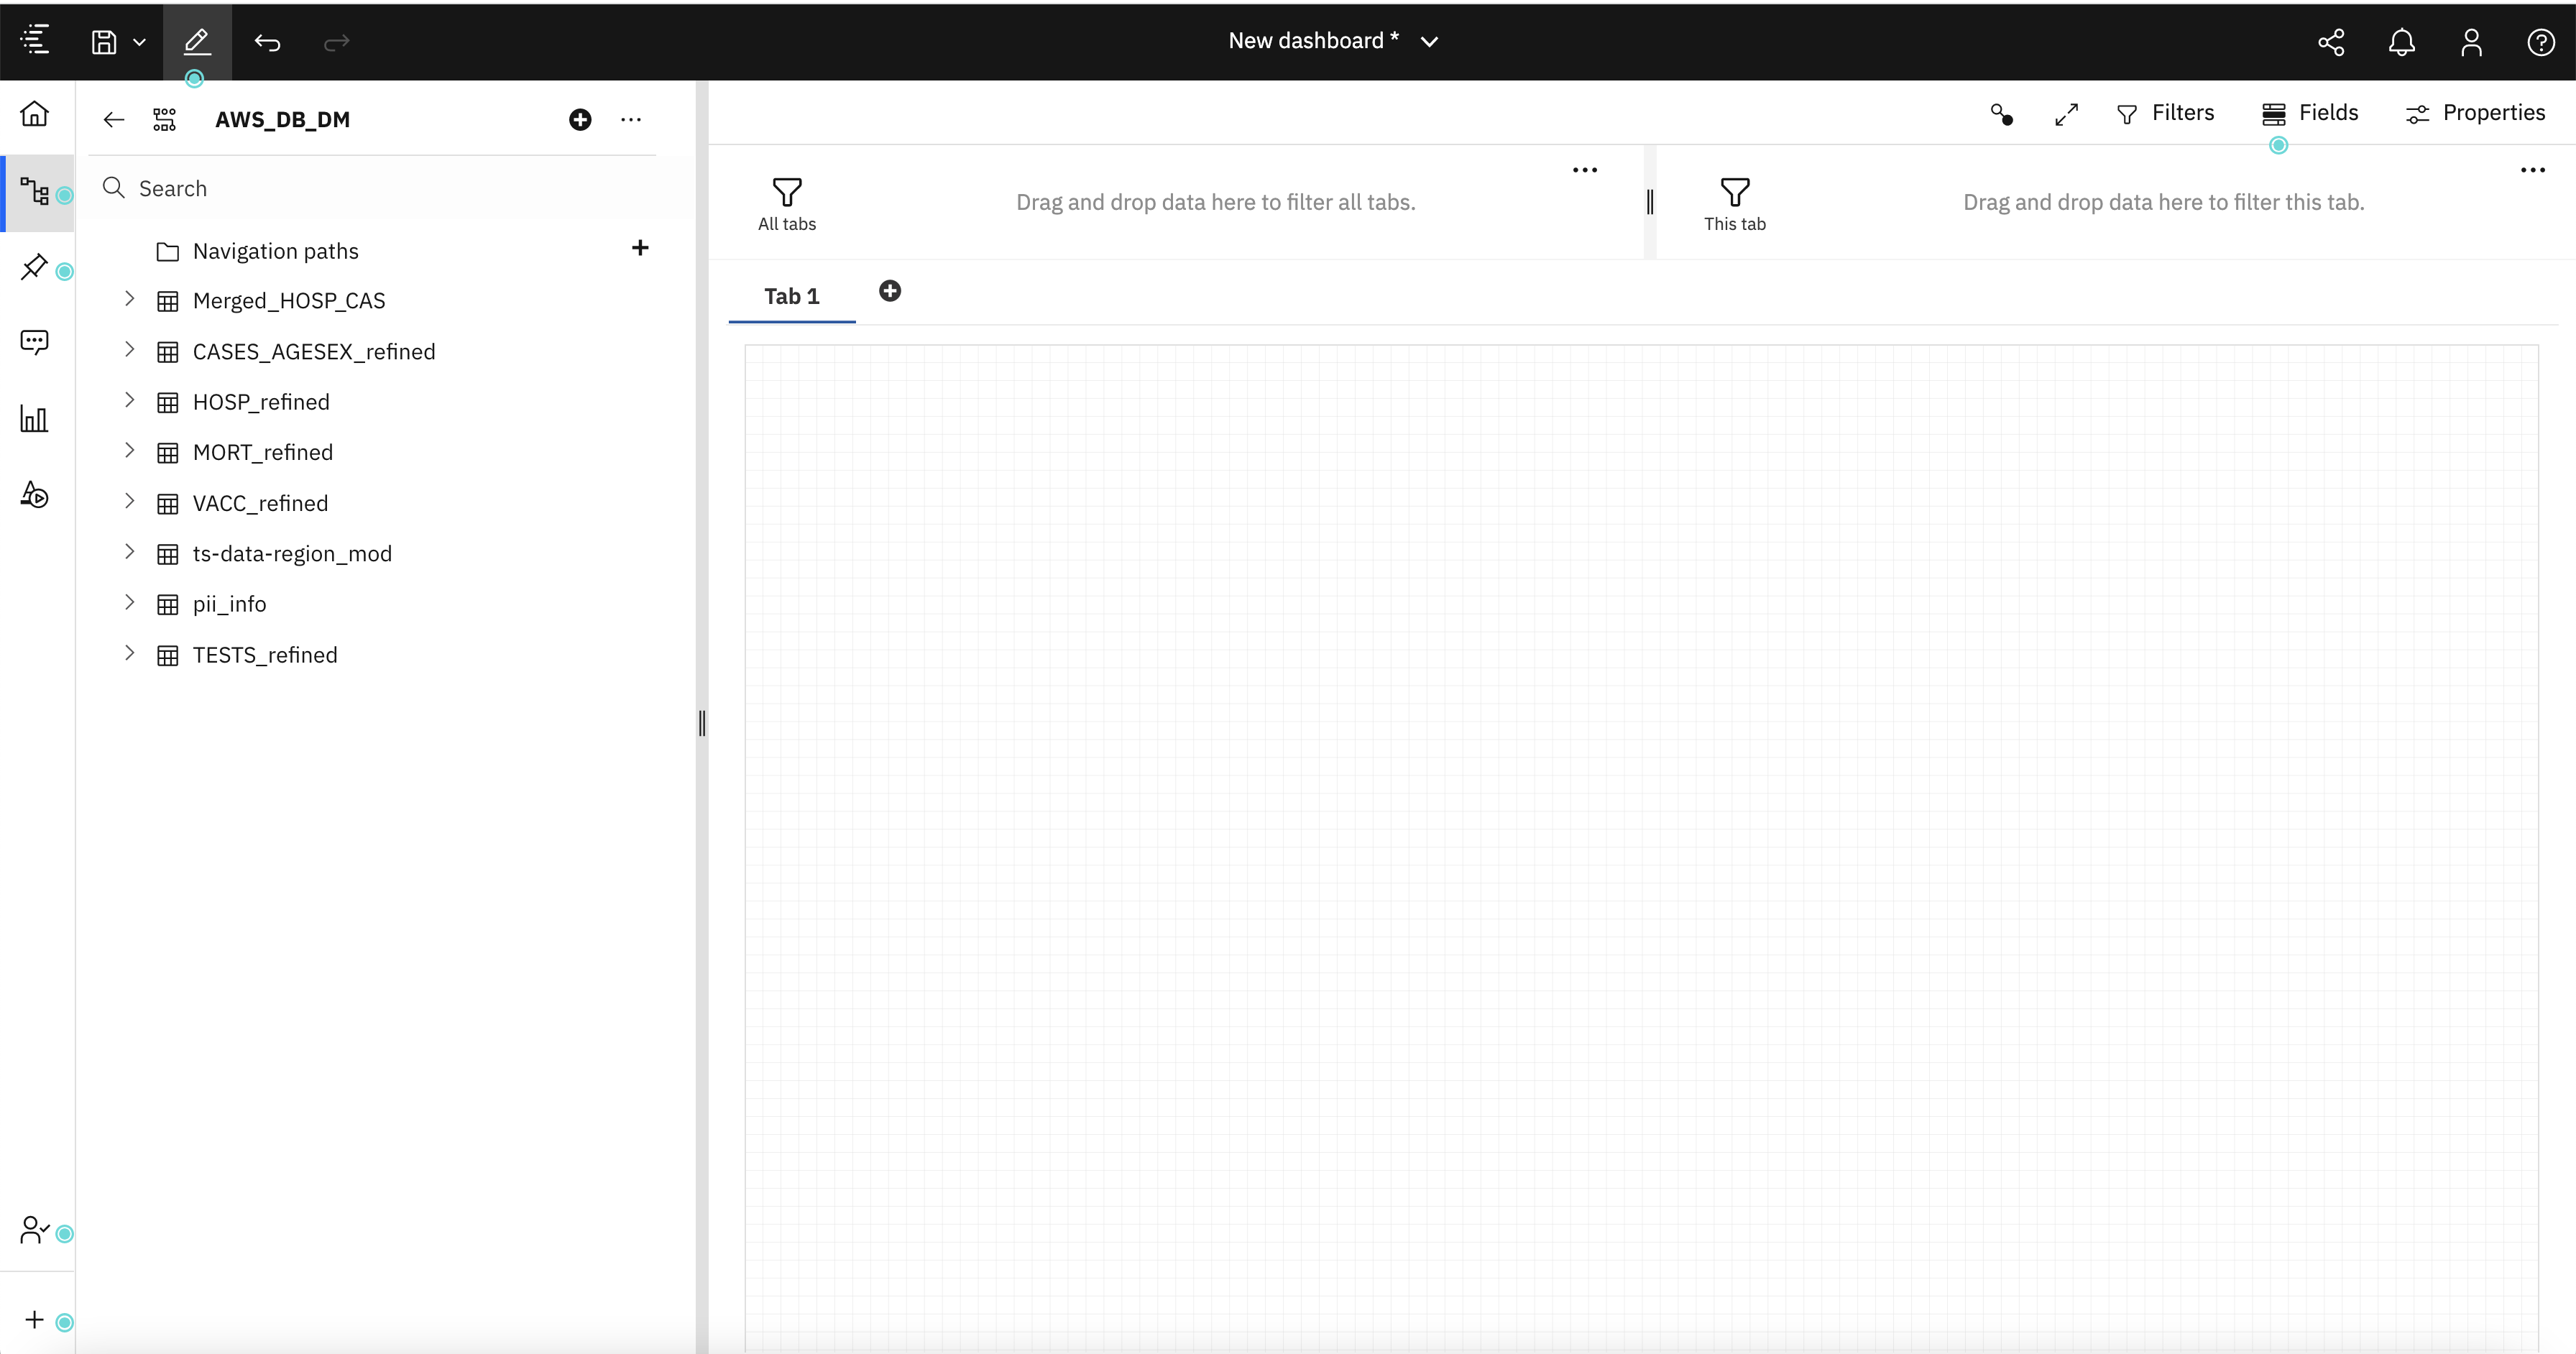
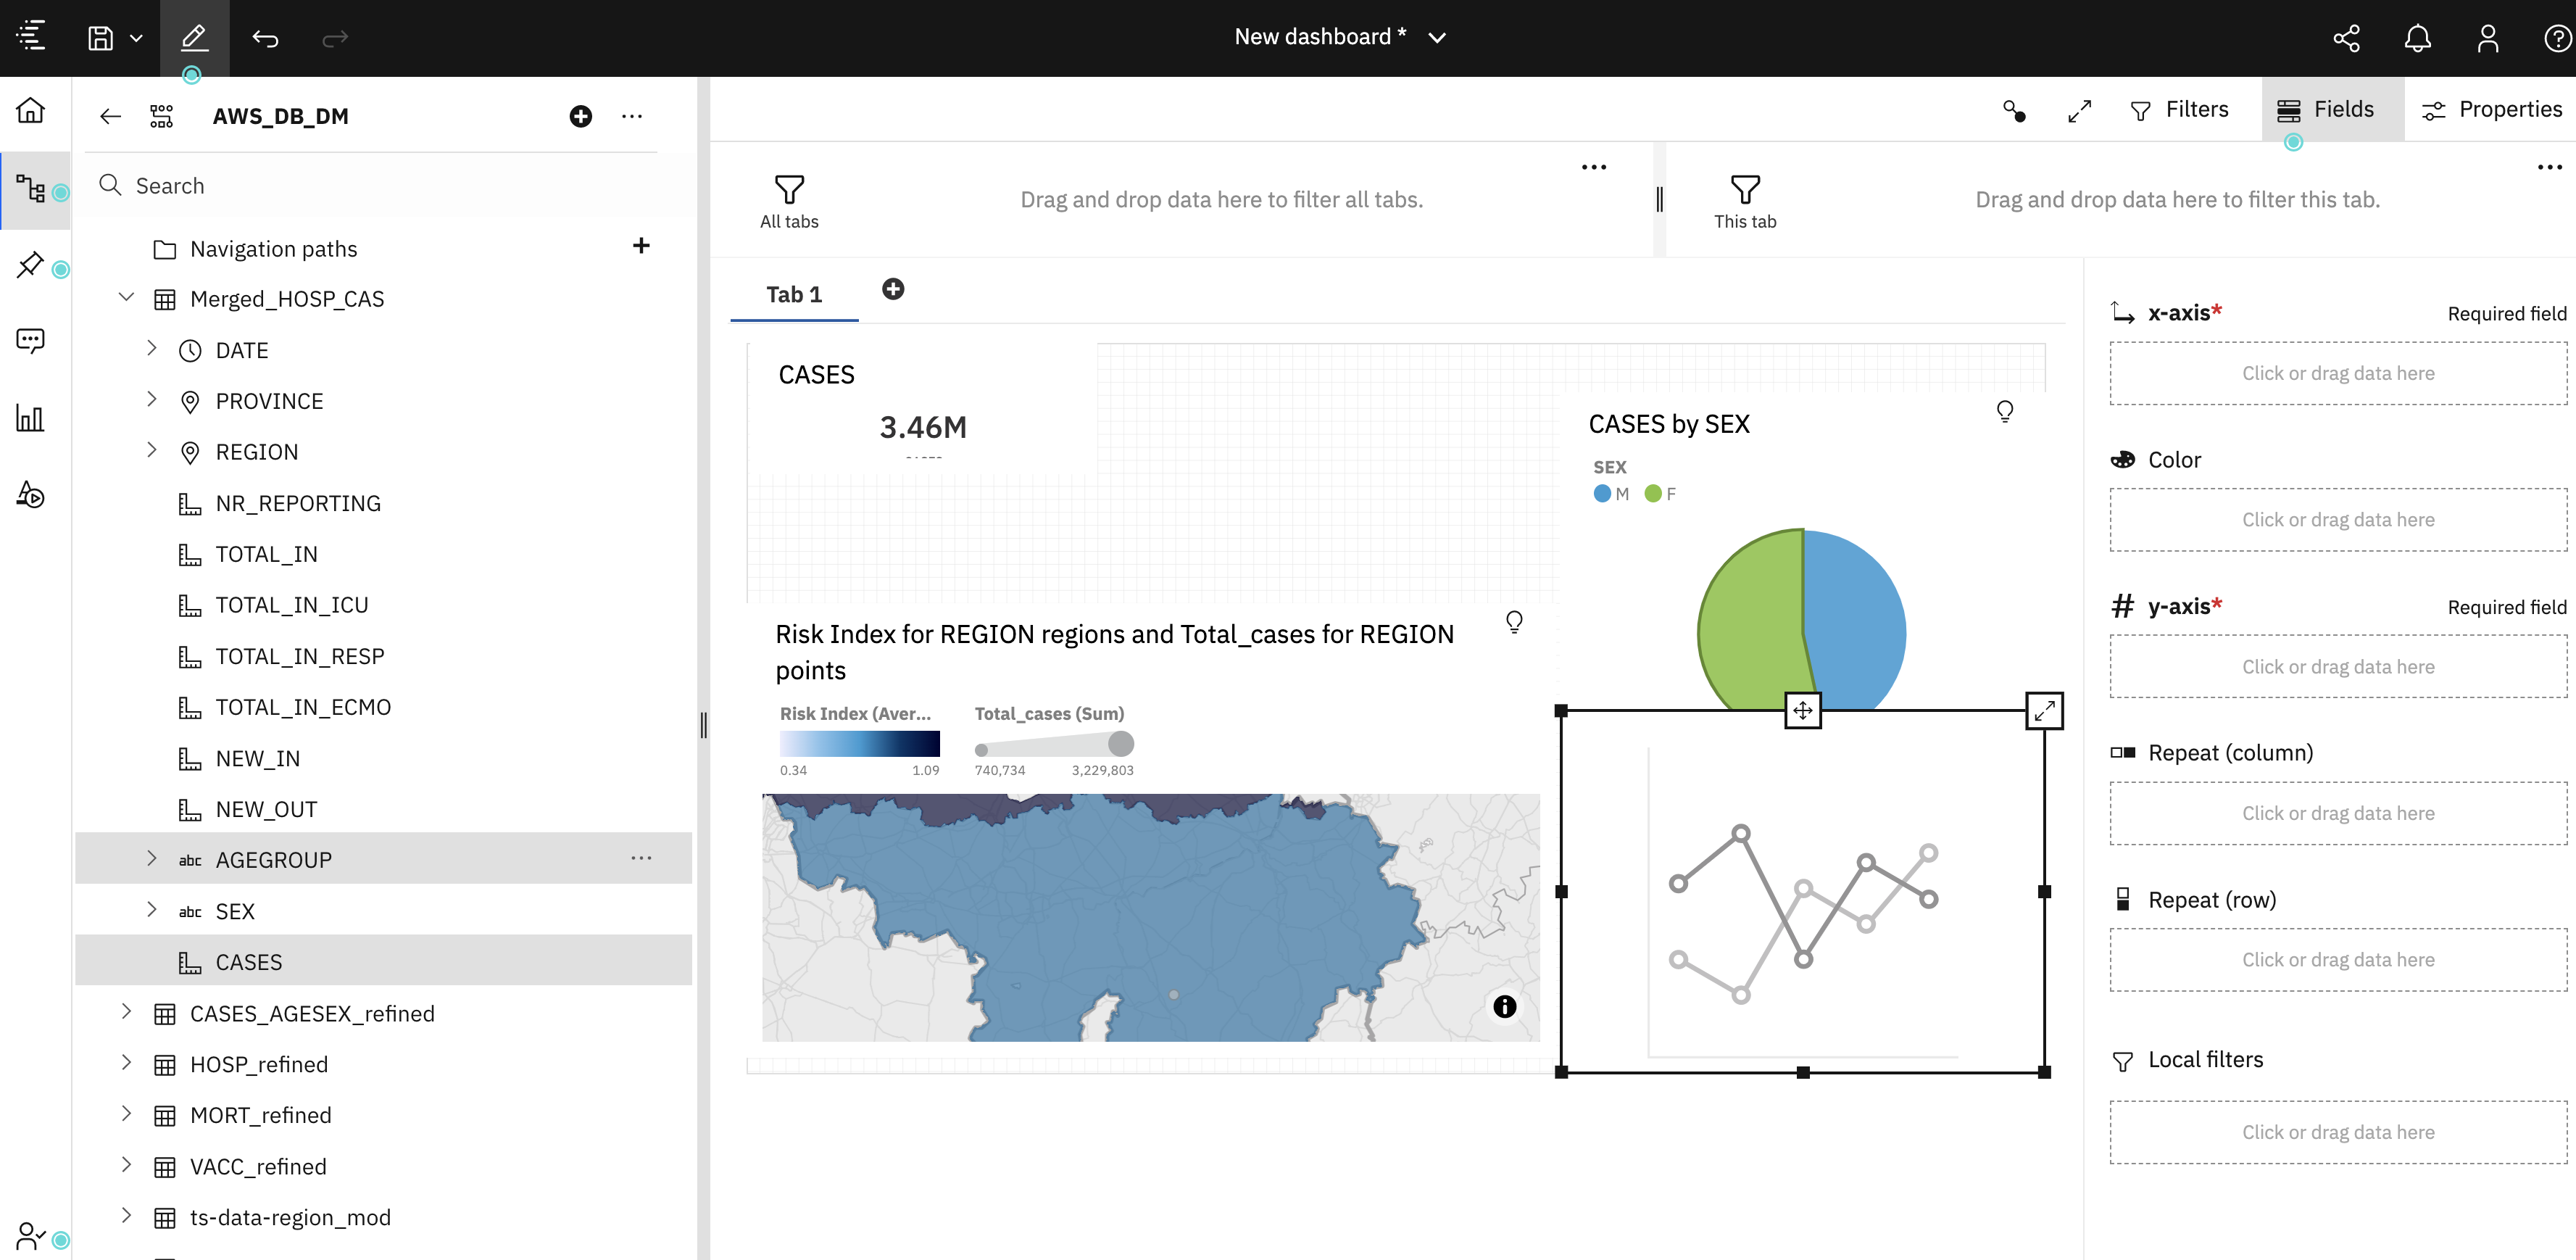
- In order to build a dashboard, one should be aware of the tools and icons how to use.
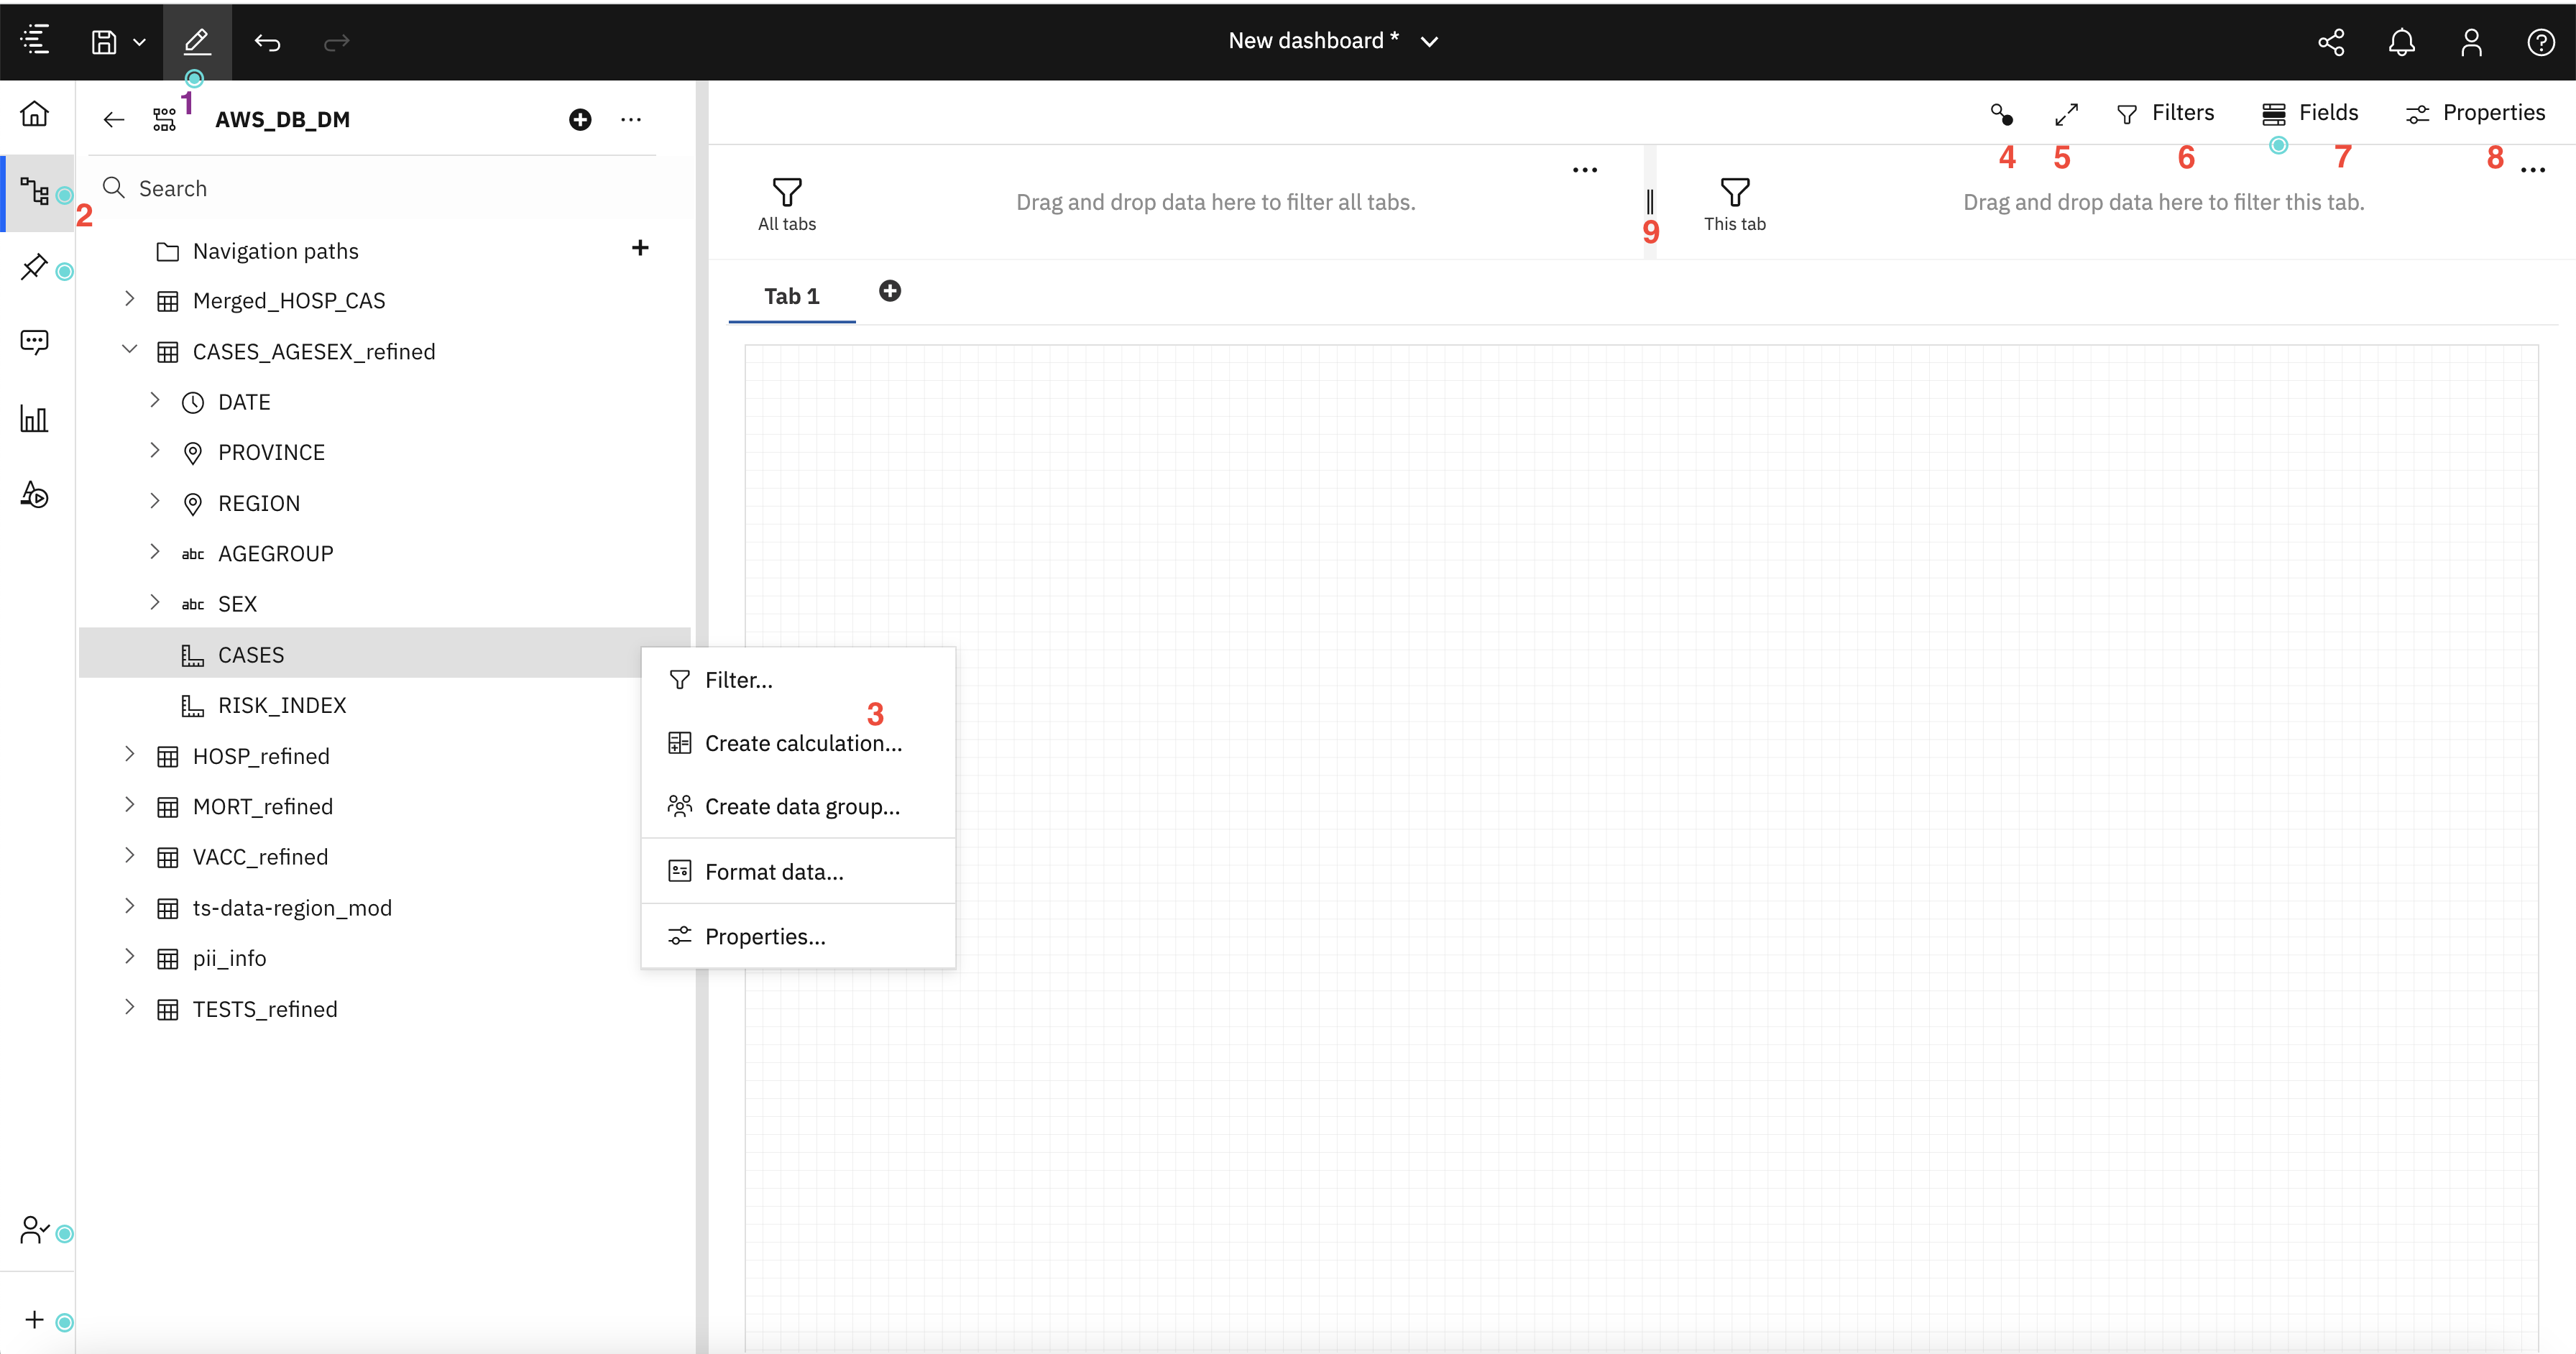
From the image above:
- [1] Toggles you between edit and preview mode.
- [2] Toggles display of the resouces (data objects) in the data module.
- [3] An example of one of many drop-down menus associated with data objects.
- [4] Displays the relationship between all of the visual objects on your dashboard. Objects with the same number are related.
- [5] Toggles full-screen mode on and off.
- [6] Toggles display of the filter panels.
- [7] Displays the fields associated with the selected visual object.
- [8] Displays the properties associated with the selected visual object.
- [9] Filters that can be applied to dashboard visual objects. The filter can be set for all dashboard tabs (left side), or for the current tab (righ side).
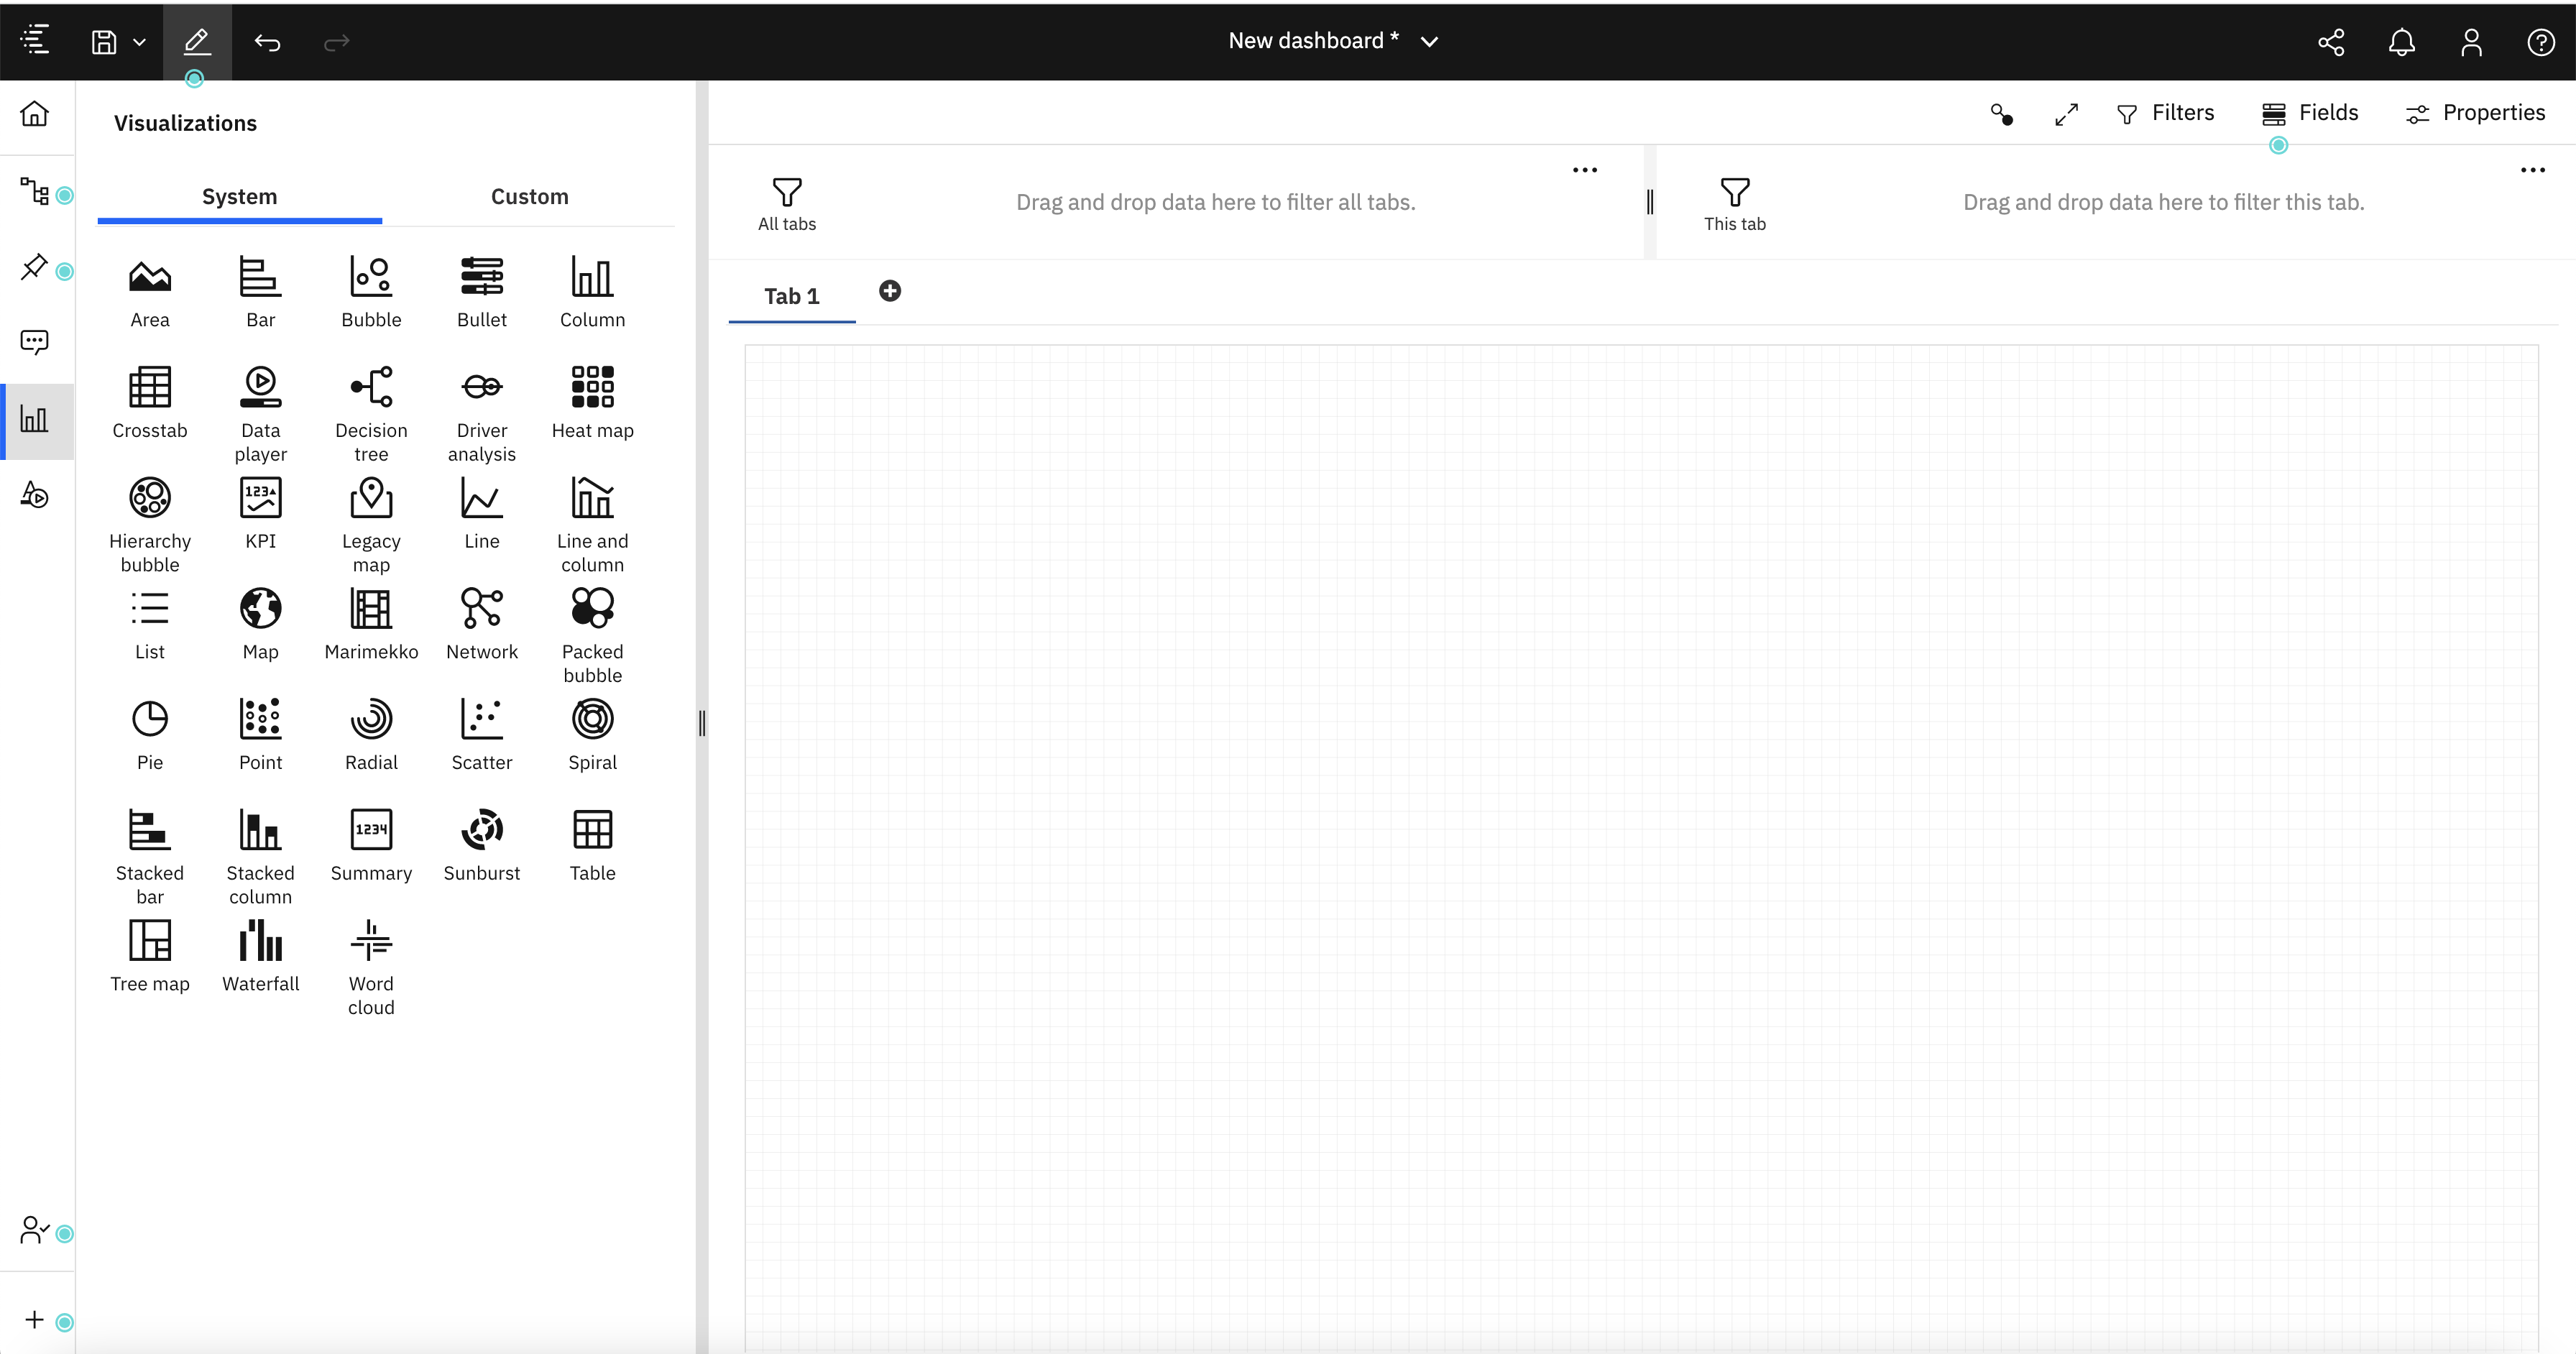
- There are different types of visualizations available for us to consume. See below screenshot for reference.
Add visualizations to the dashboard
Risk Index Chart
Our first visualization will be a Map containing “Risk Index for REGION”. It will also serve as a filter - if a region is selected, all of the other visualizations on the dashboard will change its focus to that region. Example, if we select ‘Belgium’ region, then the rest of the widgets in the dashboard will filter for that region.
- Select ‘REGION’ and ‘Risk Index’ from the -> ts-data-region_mod in the resource list and drag it onto the canvas.
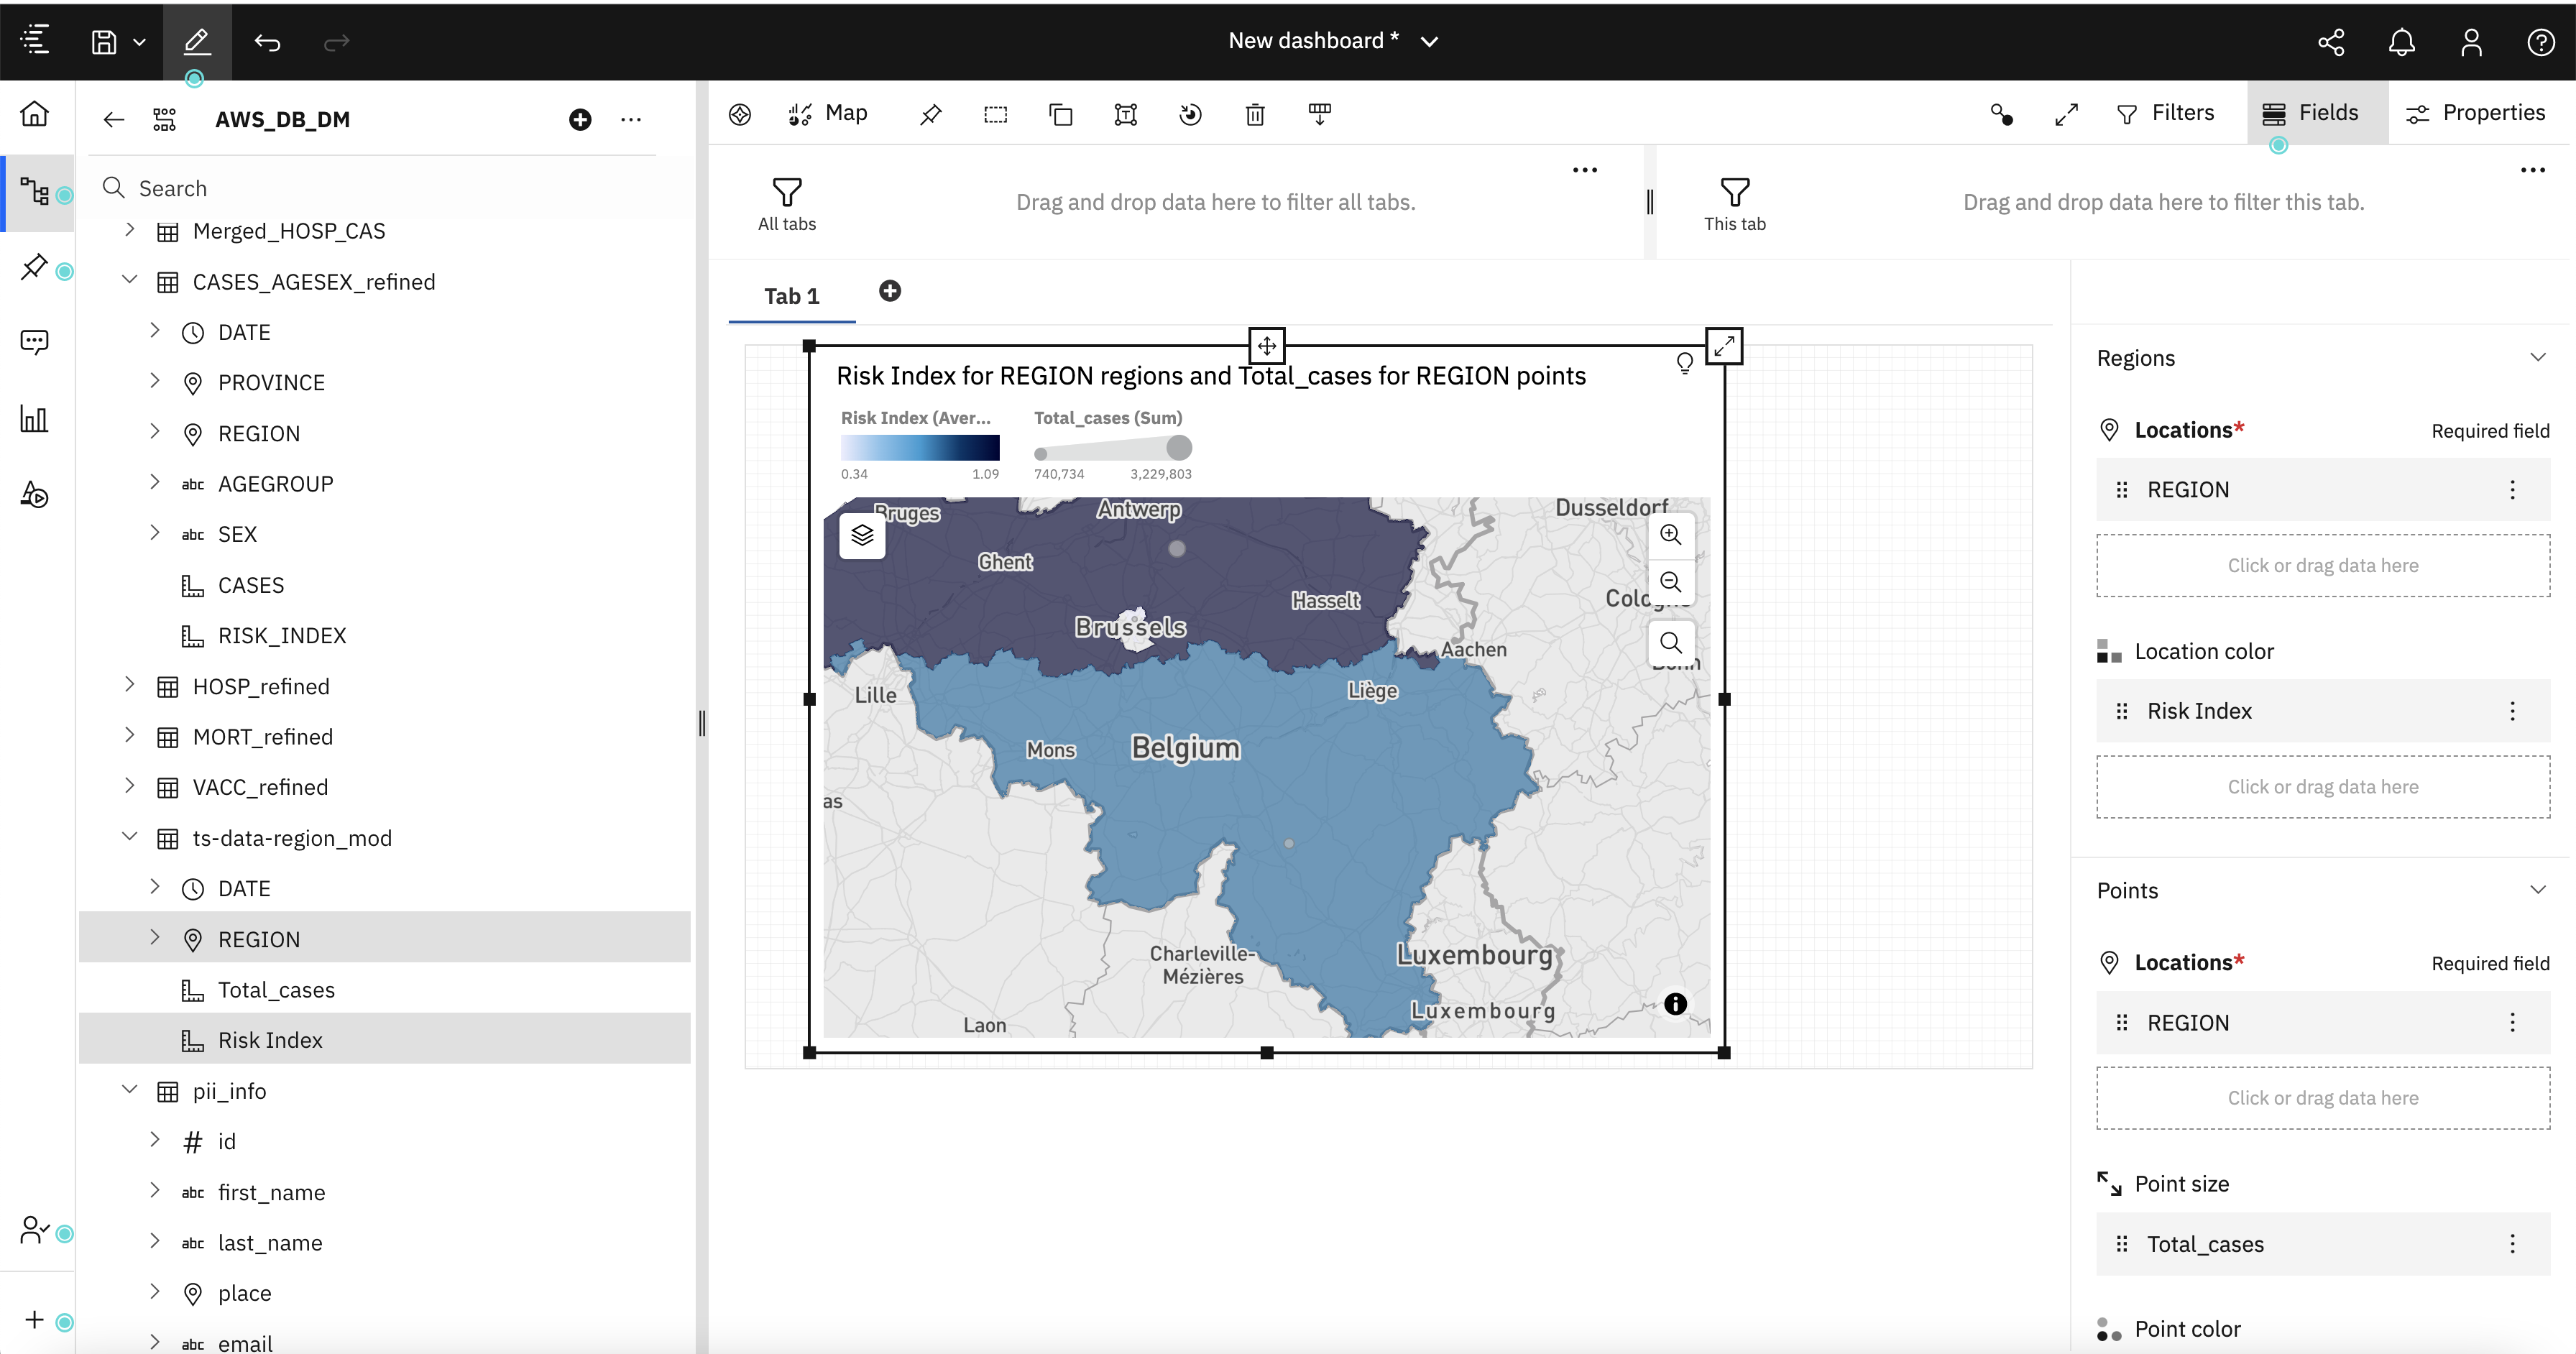
-
Use the box sizing tools to position the box in the upper left-hand corner of the dashboard.
-
Use the Expand/Collapse button in the upper right-hand corner of your visualization to view in expanded or collapse the view in your dashboard canvas.
-
Now, you can play with the properties for this widget. For example, we can disable the chart legend. See below screenshot for reference.
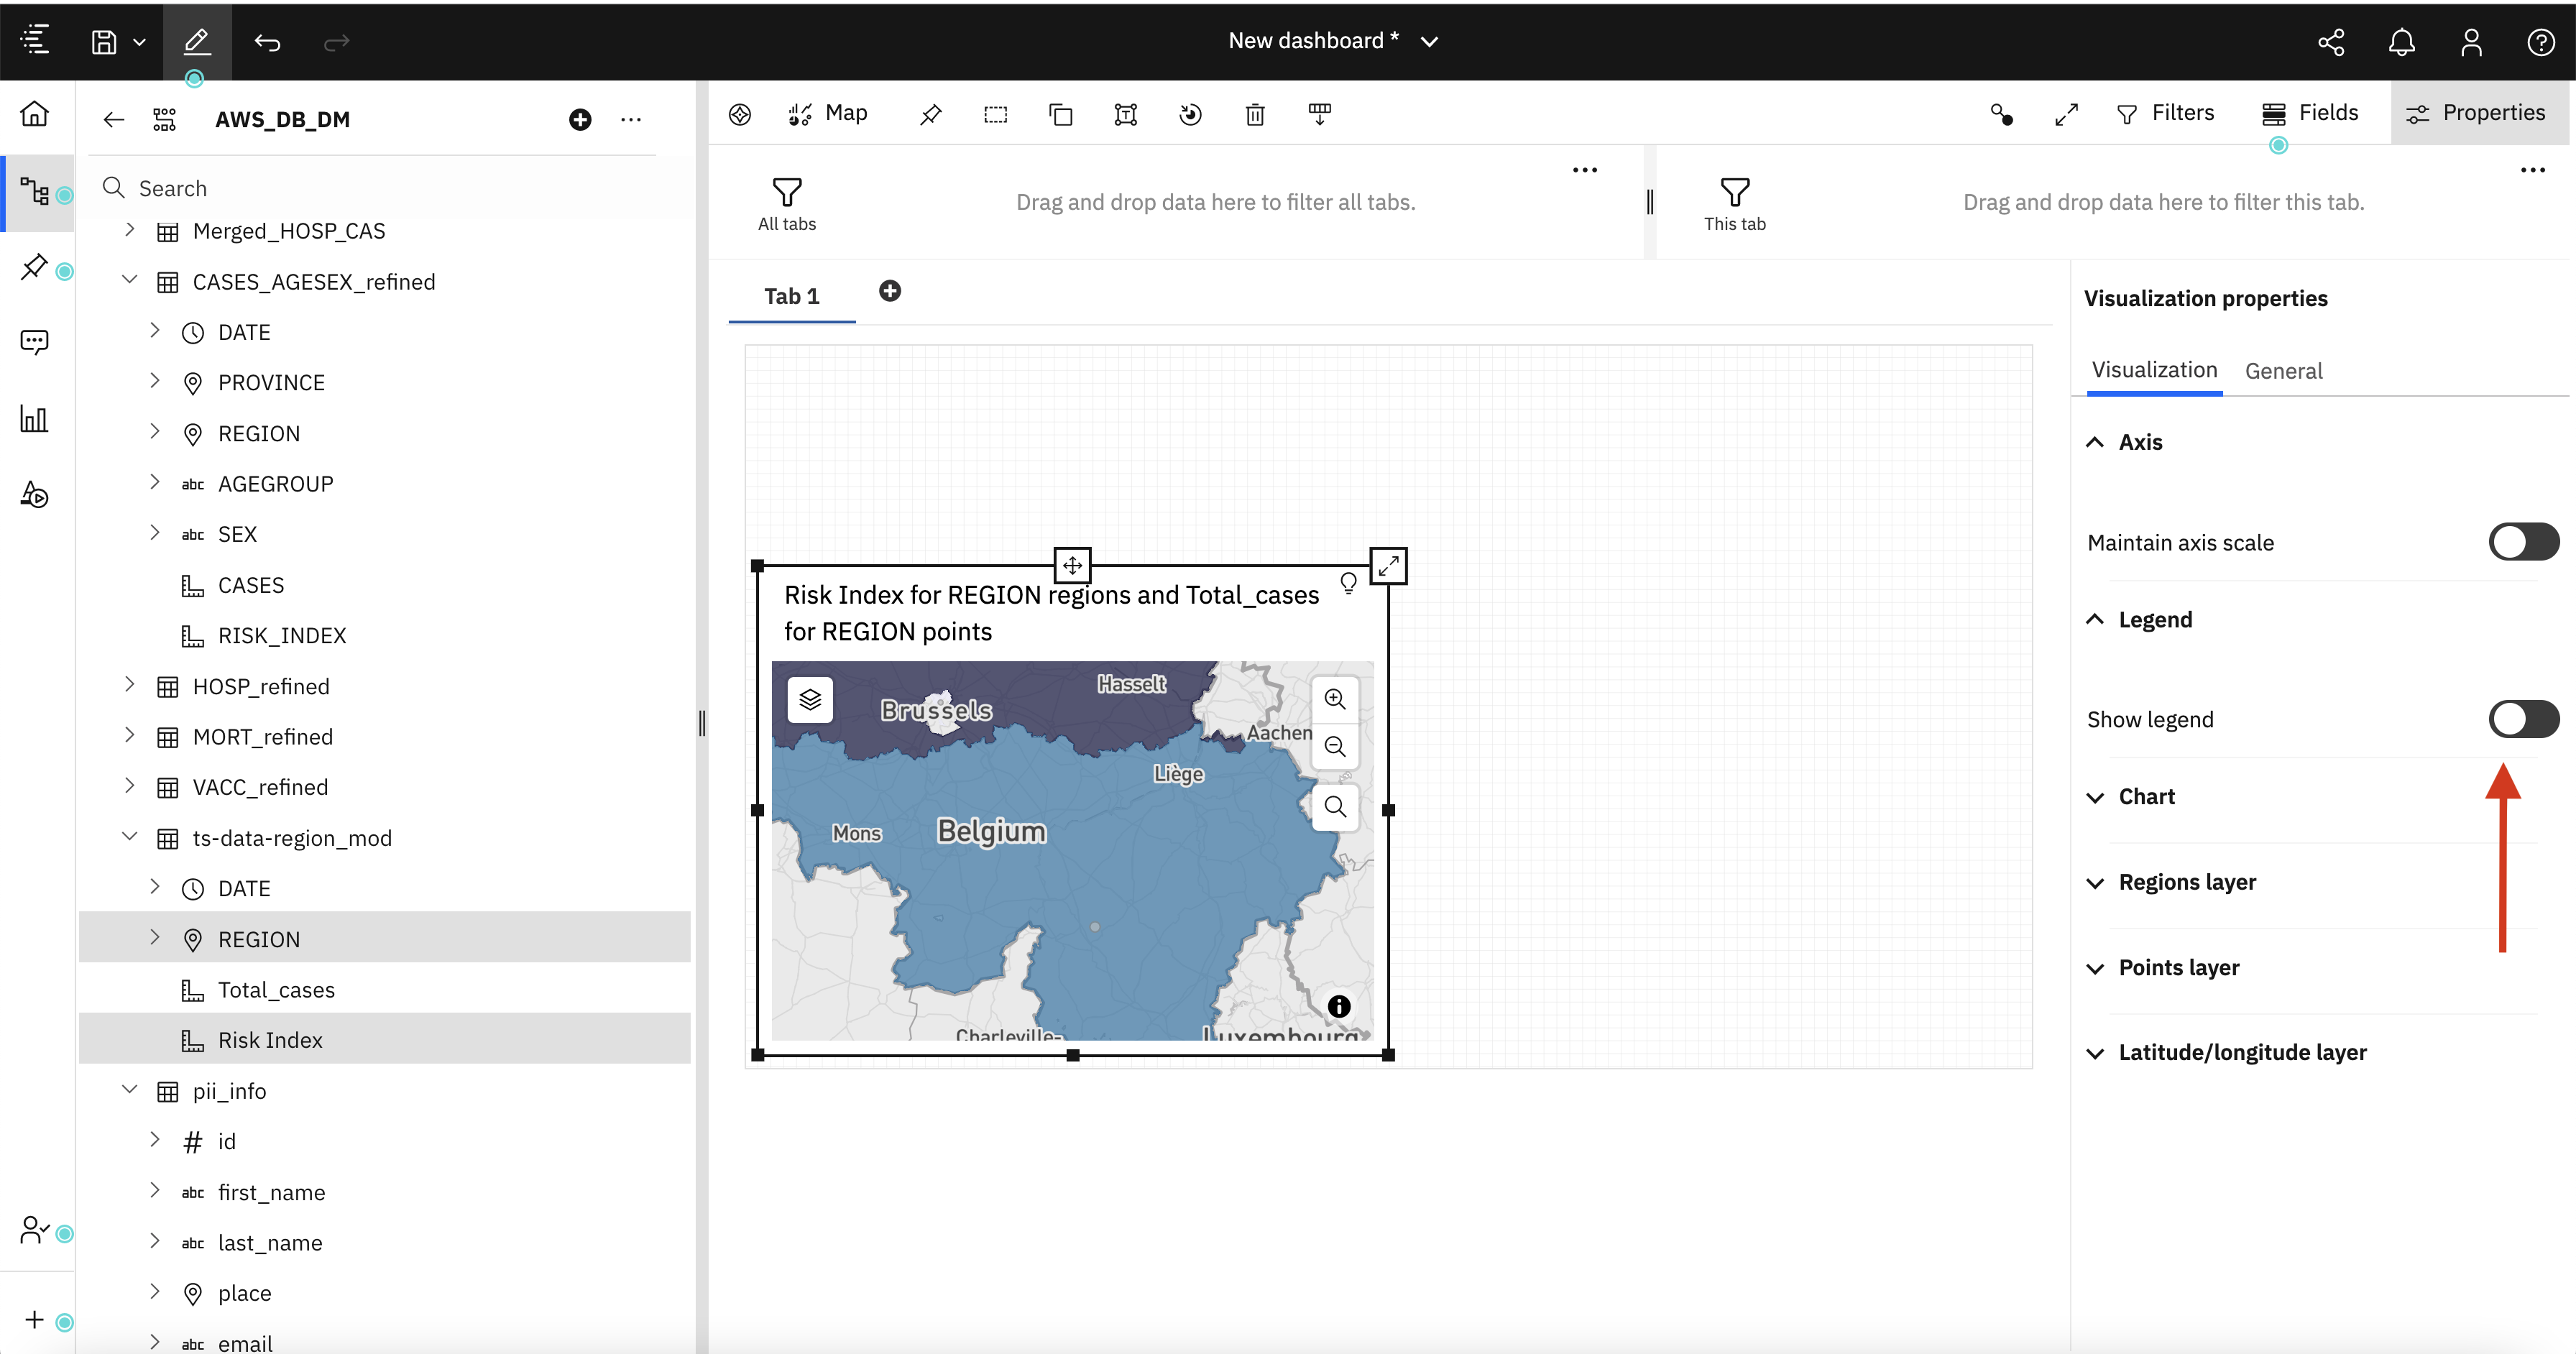
-
Using the same methods described for Risk Index map widget, change the title, axis labels, and color, etc..
Summary Metrics Widget
-
Next we want to show the summary of metrics such as Total number of Active Cases bye region, Total deaths, Total Vaccination, Total tests done, etc..
-
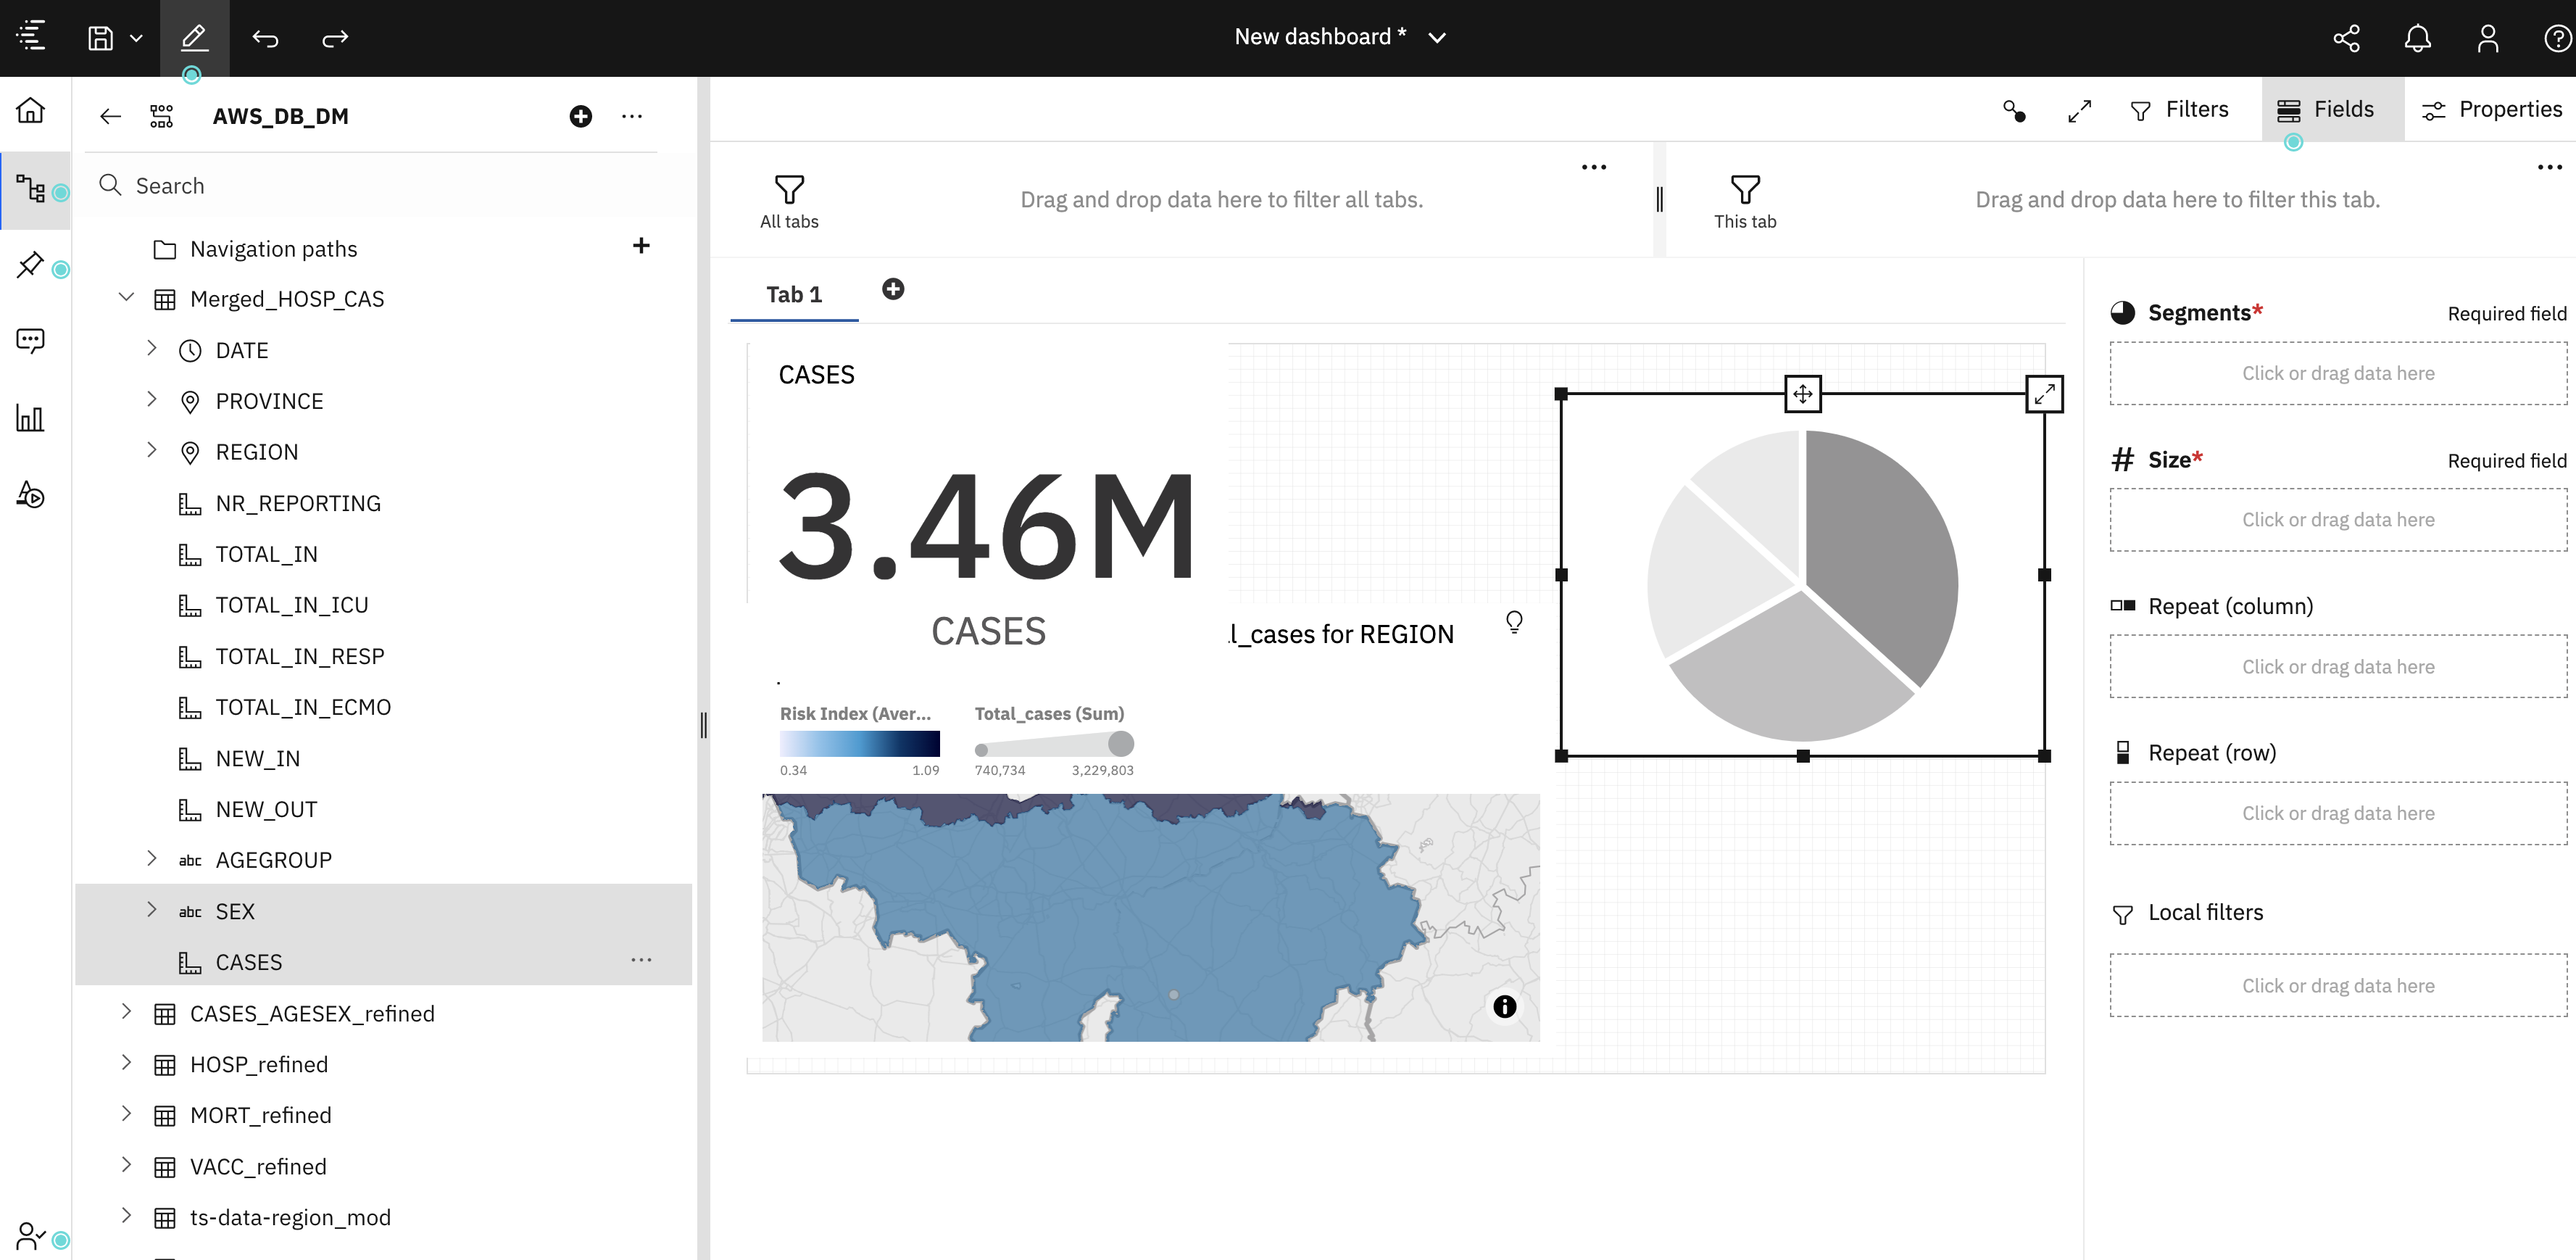
From the available visualizations, drag and drop the summary vissualization onto the canvas. See below screenshot for refernce.
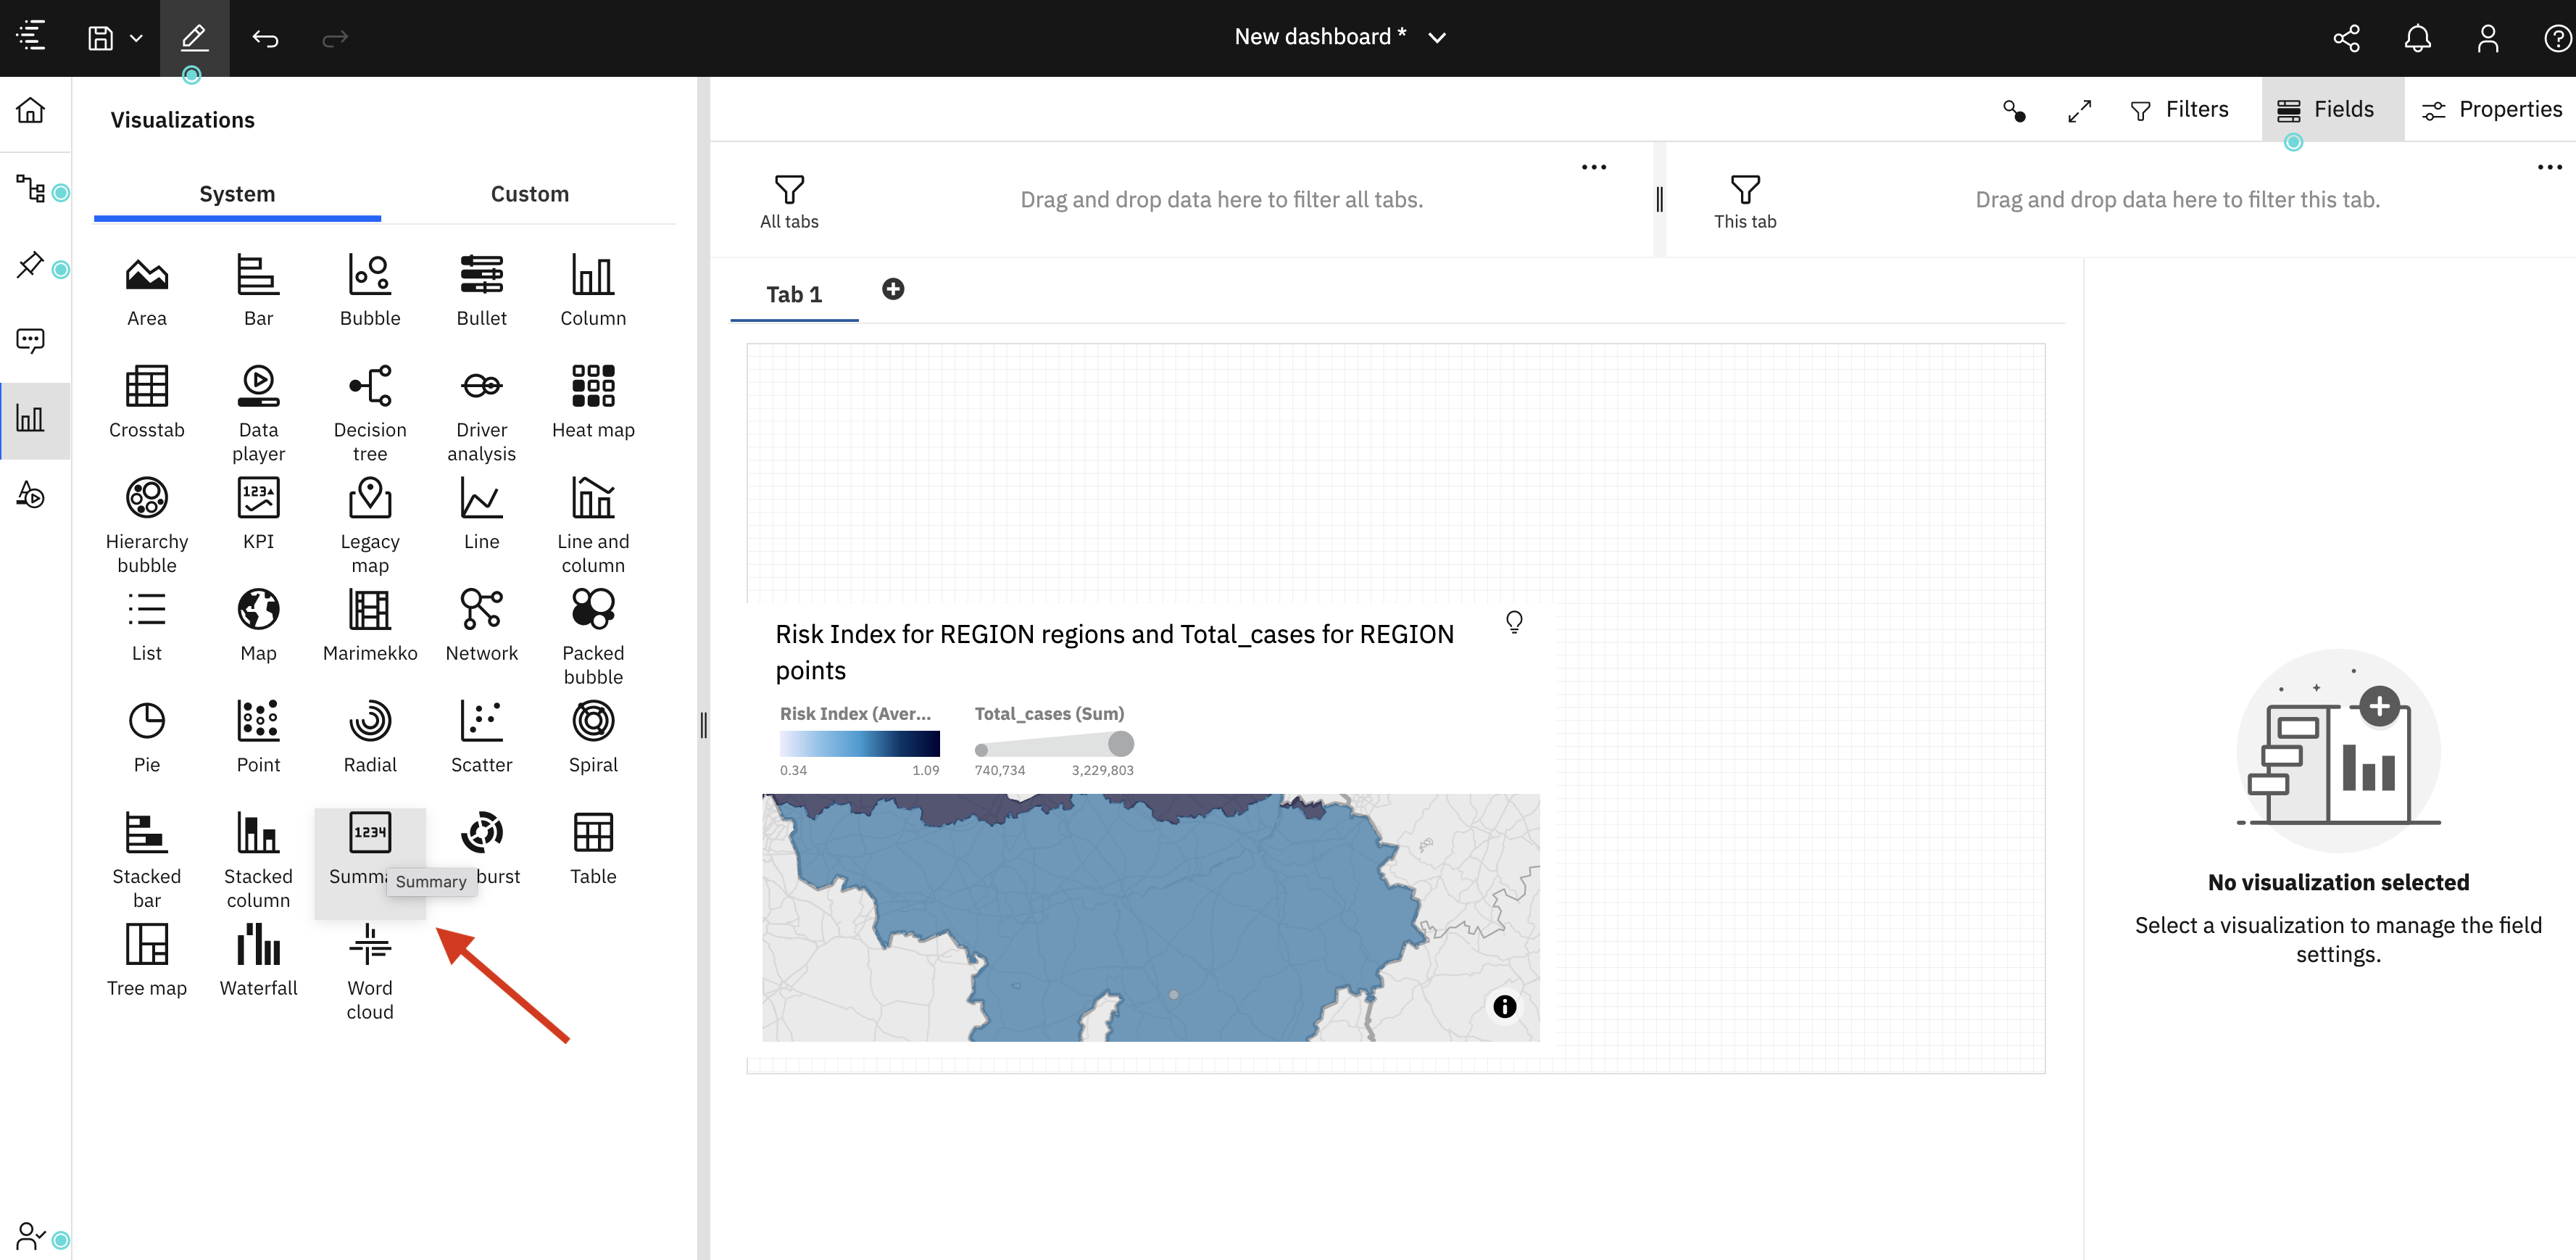
-
Select CASES field from the Merged_HOSP_CAS of the resource list. You will then see the total active covid cases for all the regions.
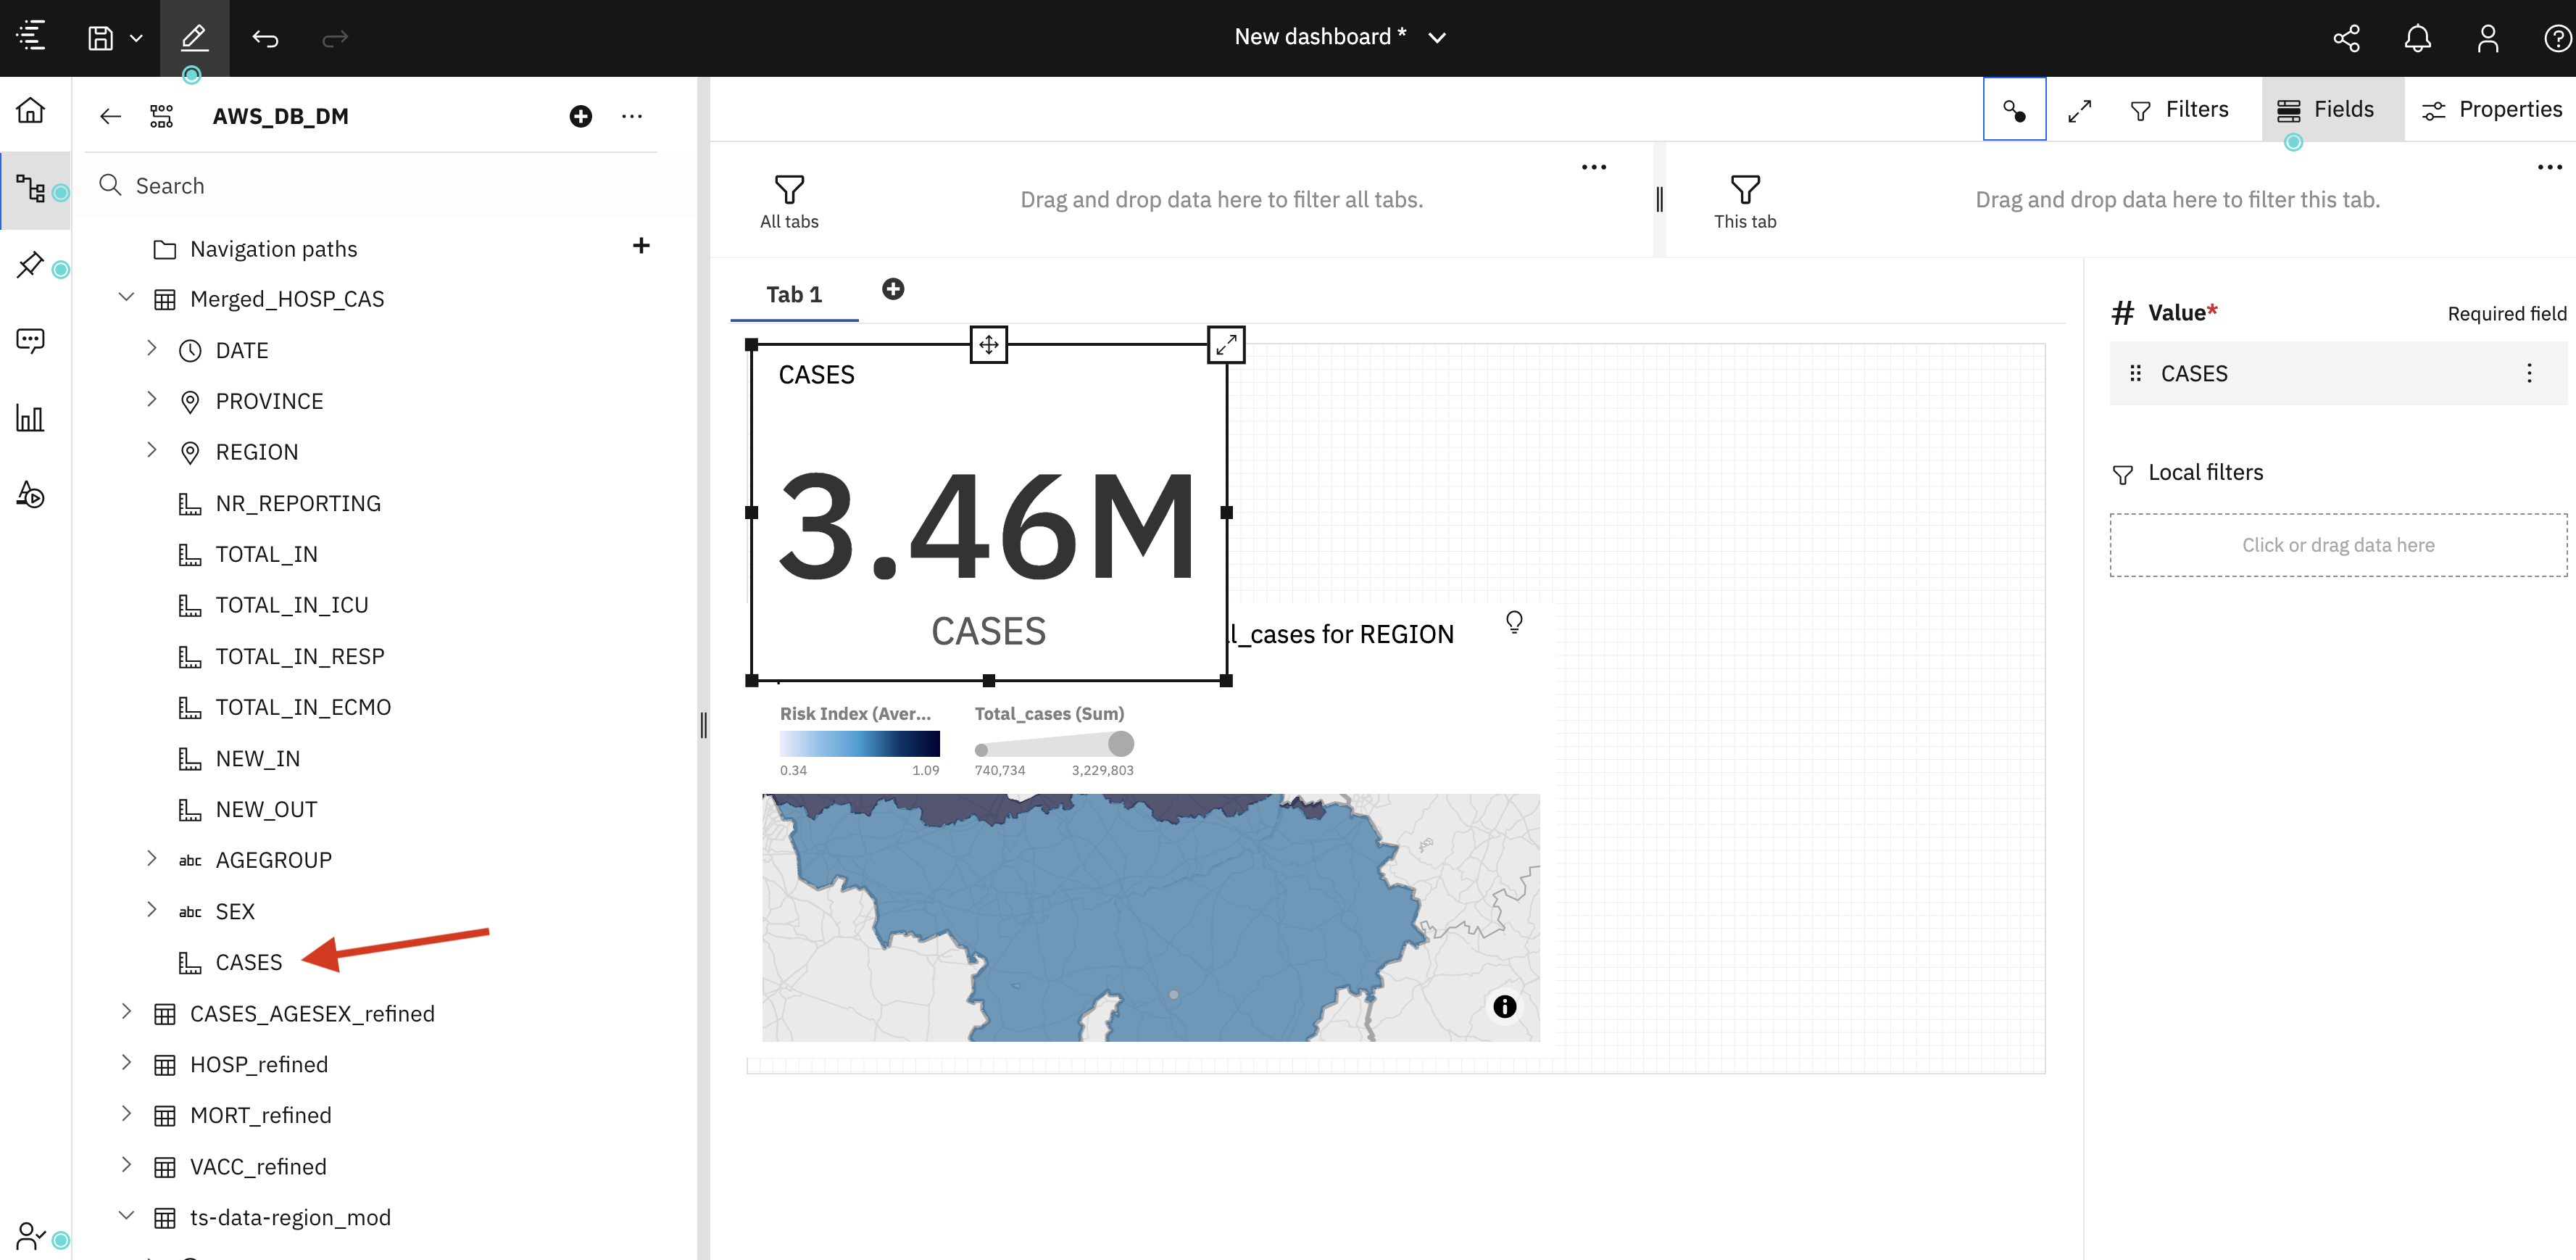
-
Similary create summary for others. Such as :
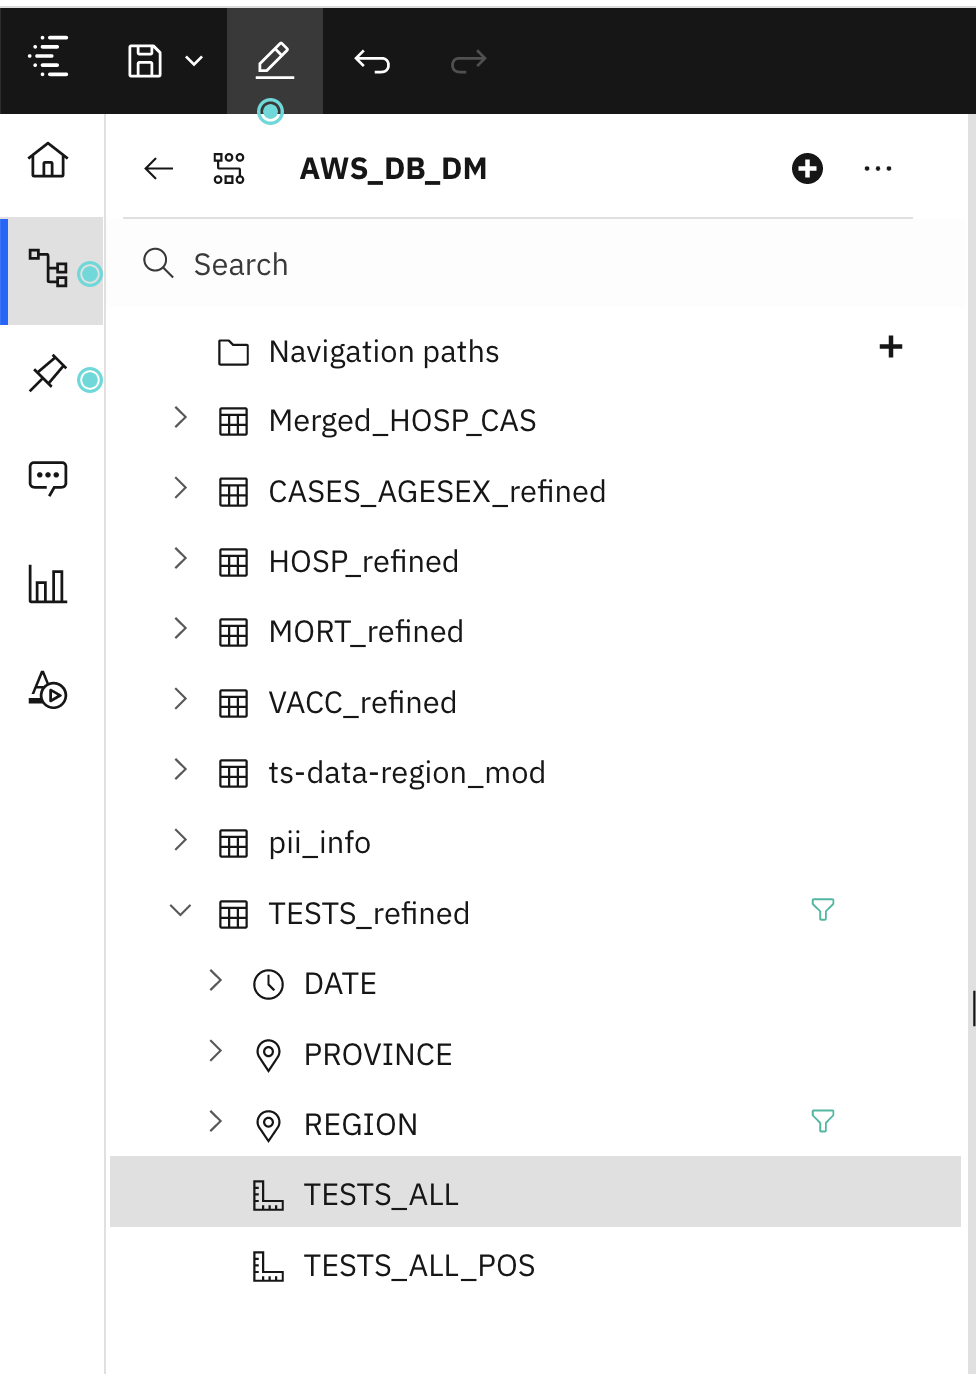
- Total Tests count from the Tests_Refined Resource list.
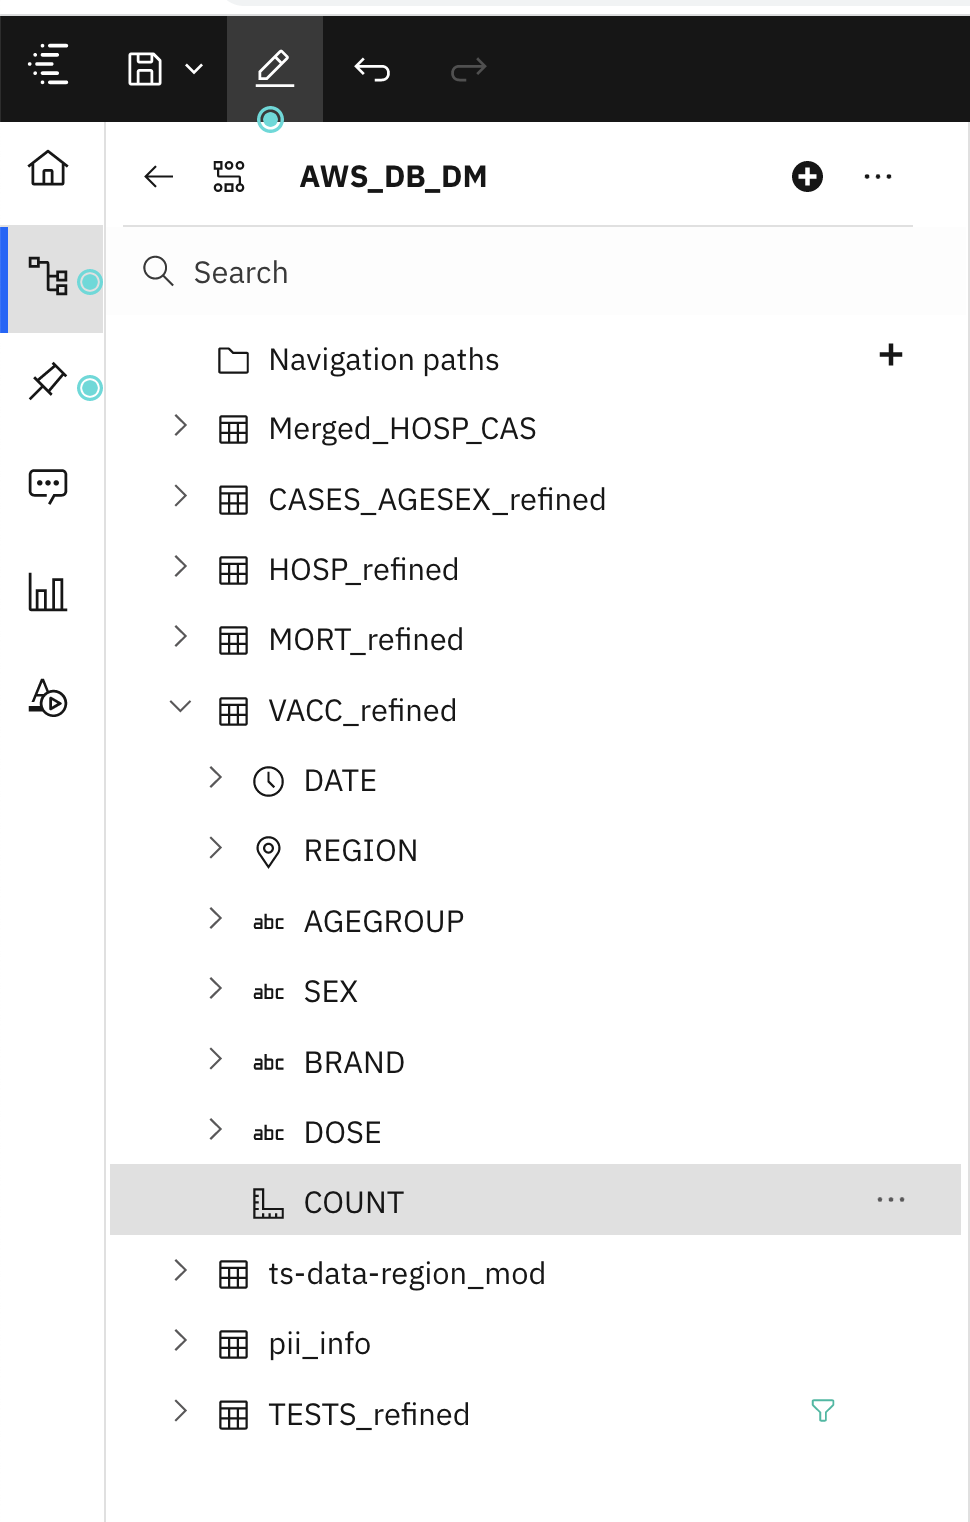
- Total Vaccination count from the Vaccination Resource list.
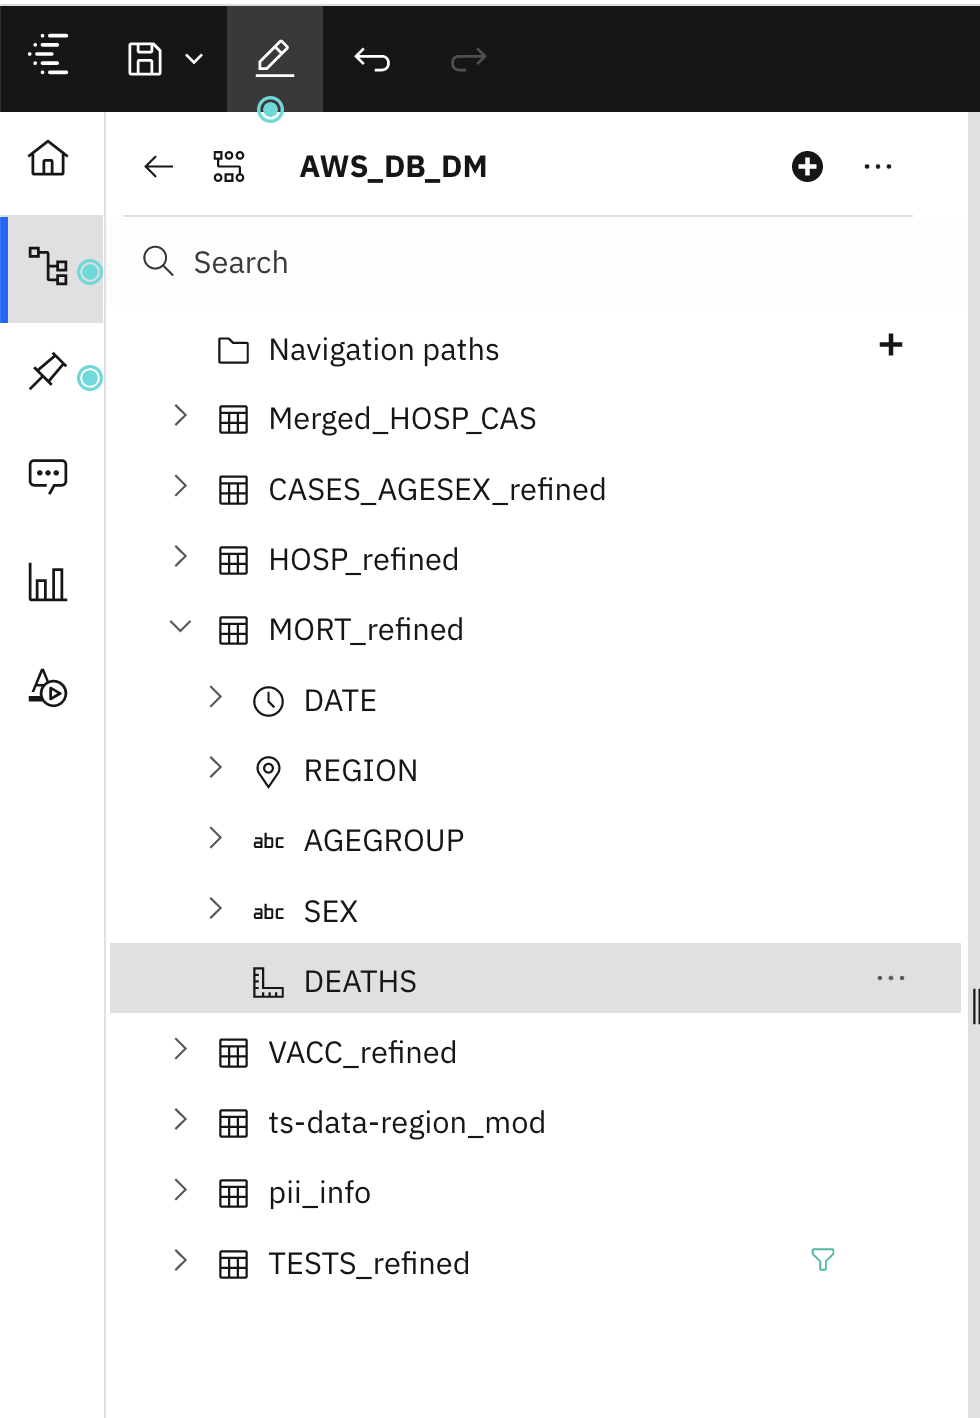
- Total Mortality/Deaths count from the Mortality Resource list.
Cases by Gender and Age group
-
Similar to the Risk Index chart, we want to also show Covid analysis by Gender and Age group.
-
Firstly drag and drop the pie chart visulaization on to the canvas, then Select Gender and Count from Merged_HOSP-CAS resource and drag and drop on the pie chart.
-
Similaly, create a line chart for Total covid Cases by Age Group. Drag and drop the Line chart visulaization on to the canvas, then Select Age Group and Count from Merged_HOSP-CAS resource and drag and drop on the pie chart.
-
With the above knowledge, you should be able to create other widgets such as:
- PII details of the Hospital Staff
- Total cases by province
- Total number of covid tests and how many are positive out of those tests.
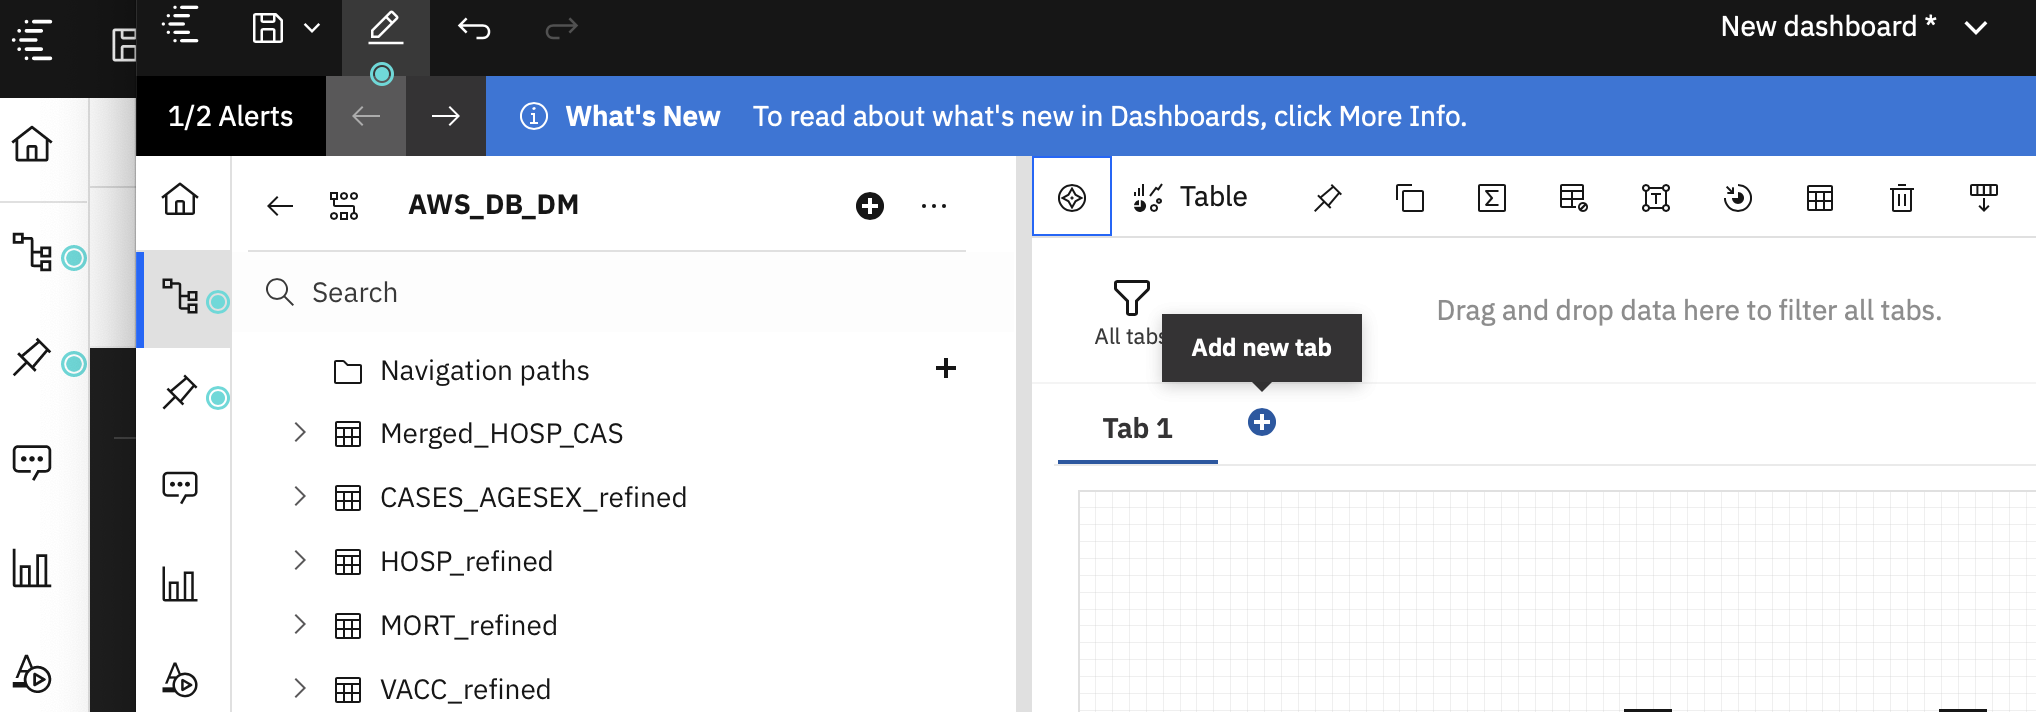
Create a second tab for Data virtualization source data within the same dashboard
- Click on Add tab to add more visualization using data virtualization as a data source.
- Click Select a source and Select the Data module you created for data virtualization source, and click Add.
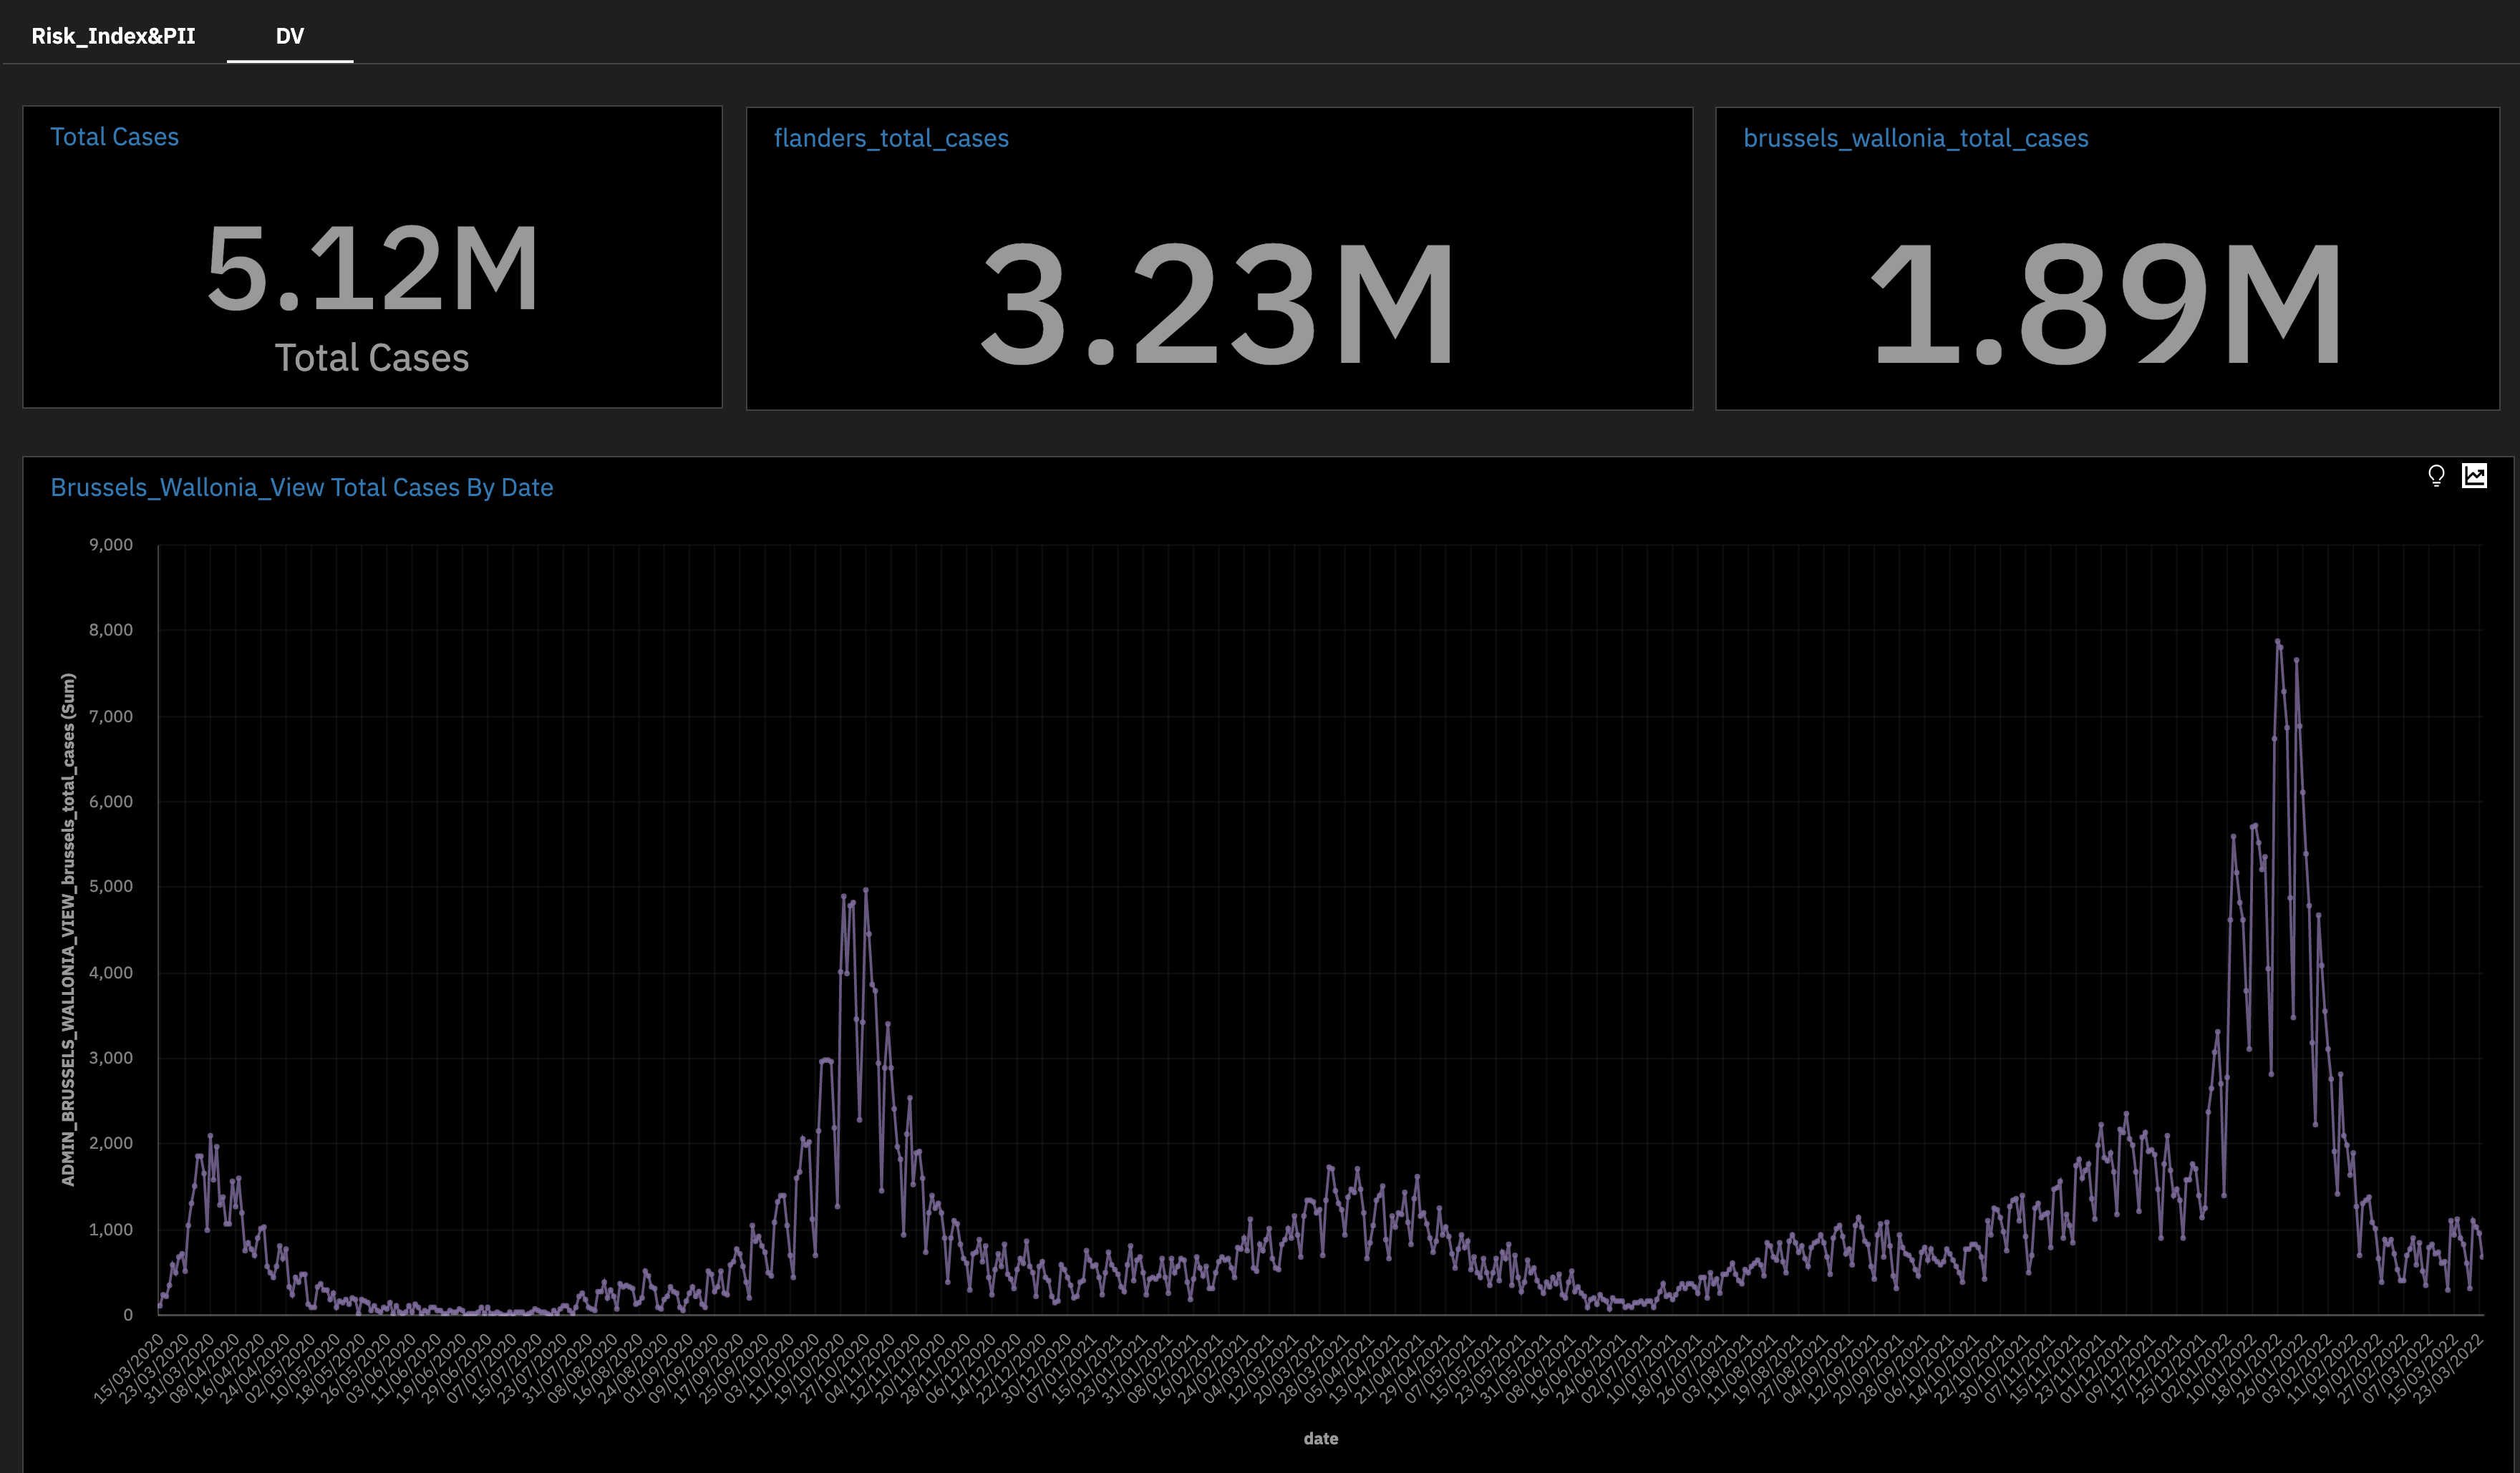
- After you add the data virtualization data source, you should be able to create widgets similar to the above steps. See the below widget for your reference which will help to create a similar one.
-
Once you complete the above widgets, Save the dashboard.
-
To convert the dahsboard visual theme, you could use the dashboard properties and select the Dark scheme from Color and themetab. See below screenshot for refernce.

Congratulations! You have completed your first Cognos Analytics dashboard. The layout and values should look similar to this:

NOTE: At any time, you can click on the Edit or preview button in the main menu bar to toggle between edit and preview mode. Click on Preview mode to get a better look at our current dashboard.
When toggling back to Edit mode, you may have to click the Data icon (0111) to display the resource list.